
Quickly access key hazard information
Hazard tooltip and quick links
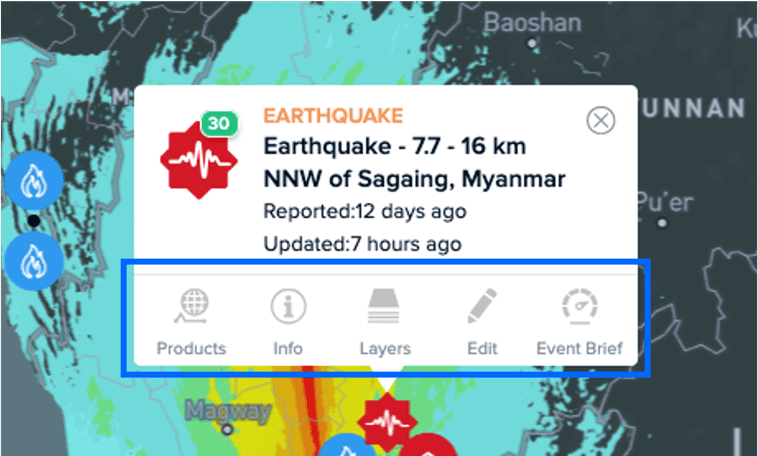
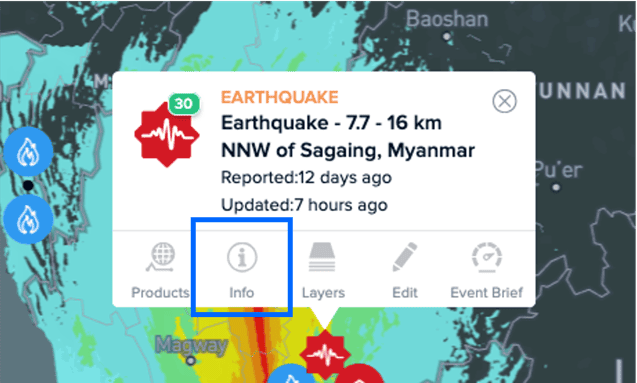
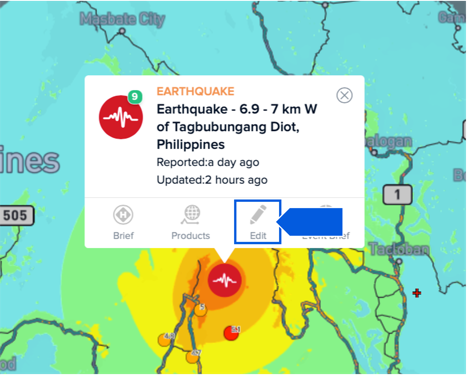
Hazard tooltips provide quick access to information to help you rapidly assess the potential impacts of hazards. To access these “quick links,” click on a hazard on the map.
The tooltip will display quick links to additional information about the selected hazard: Brief, Products, and Event Brief. The Edit quick link included below is available to Admin users.
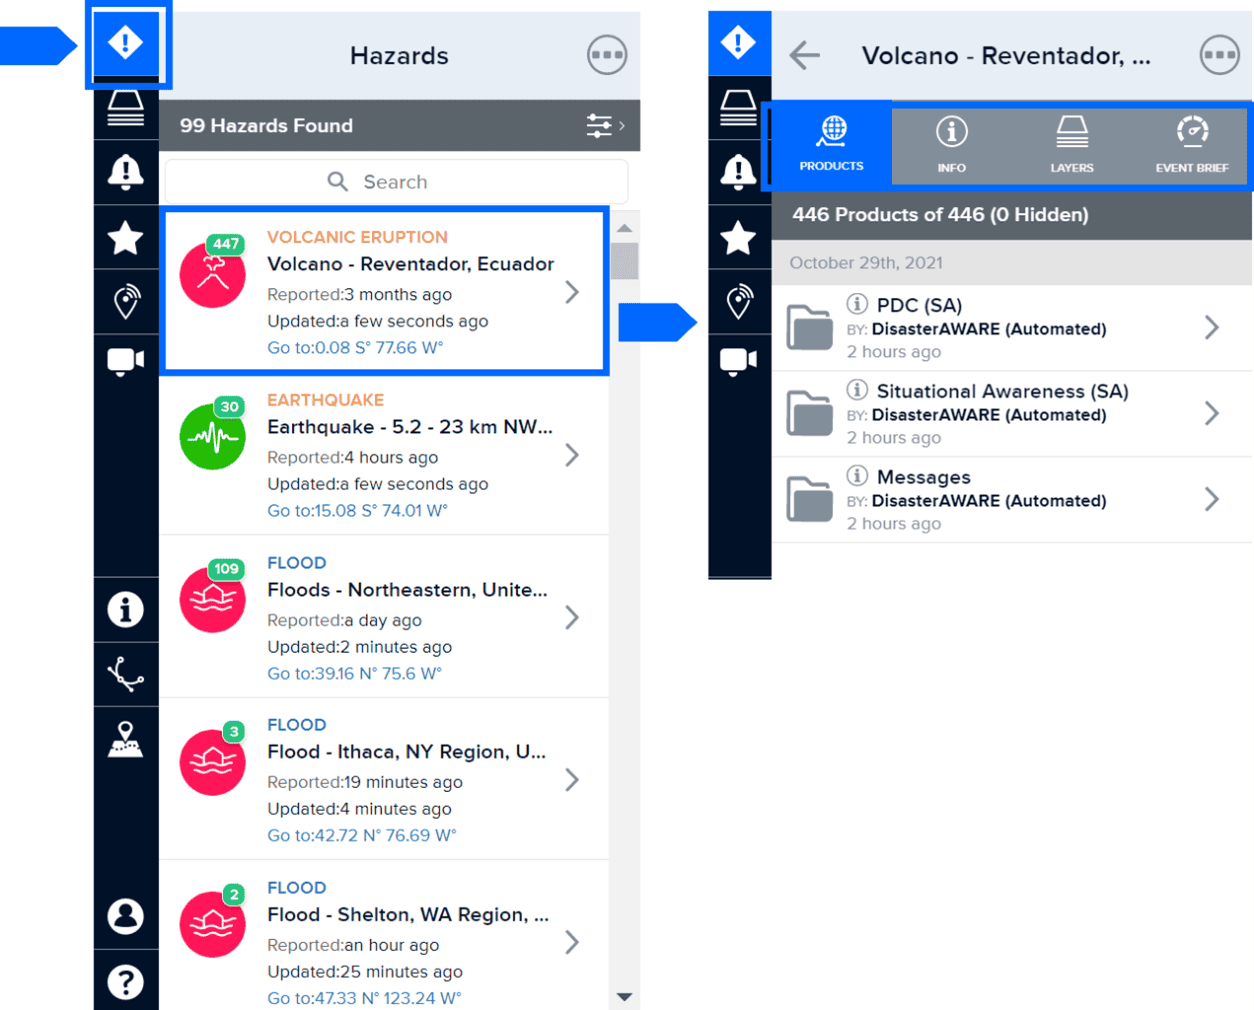
Note: You can also access a hazard’s Brief, Products, and Event Brief features by selecting the hazard from the Hazard Panel and clicking the corresponding tabs, as shown below.
Brief quick link
 |
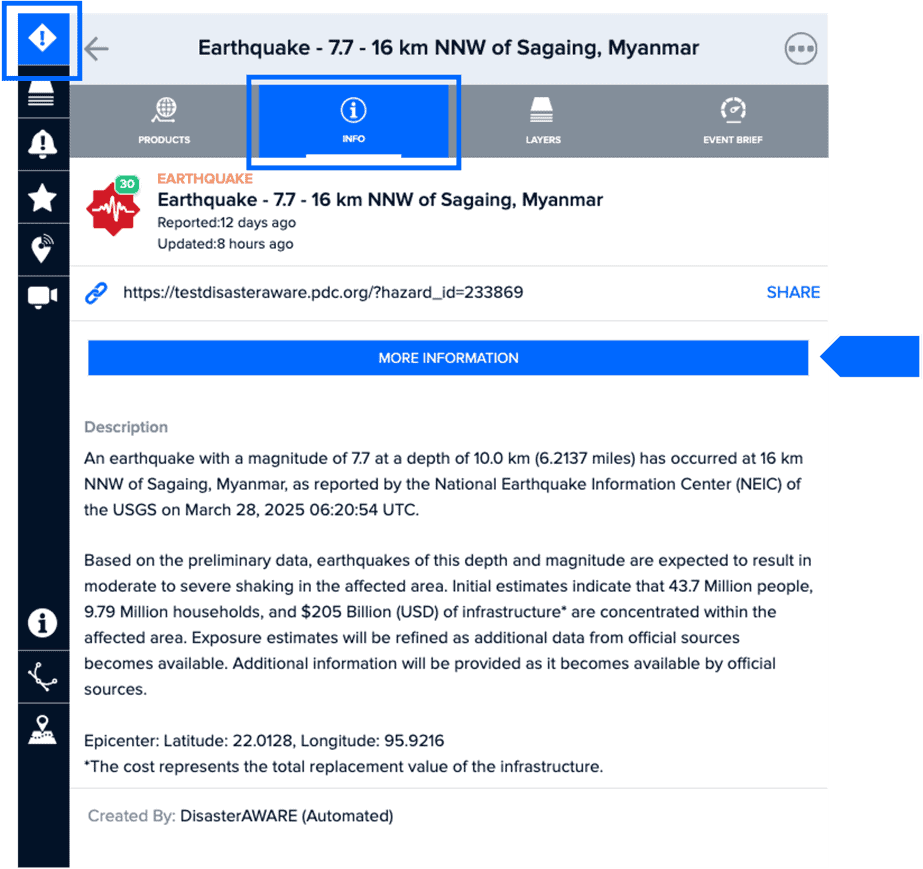
The Brief quick link provides access to key map layers related to the selected hazard type, including a summary of exposure—such as population, demographic breakdowns, capital, and critical infrastructure. It also includes a brief event description and a link to share the hazard directly with other users. |
Note: At this time, exposure data in the Brief quick link are available for all hazards except tsunamis, wildfires, manmade hazard types, and manually added hazards. A ‘No data available’ message will display for those sections. To view exposure information for those hazard types, select either the More Information button in the Brief panel or the Event Brief quick link. This feature is actively being expanded to include exposure information for those hazard types.
Select the Share option next to the URL at the top of the Brief panel to quickly copy a direct link to the hazard for easy sharing with other users.
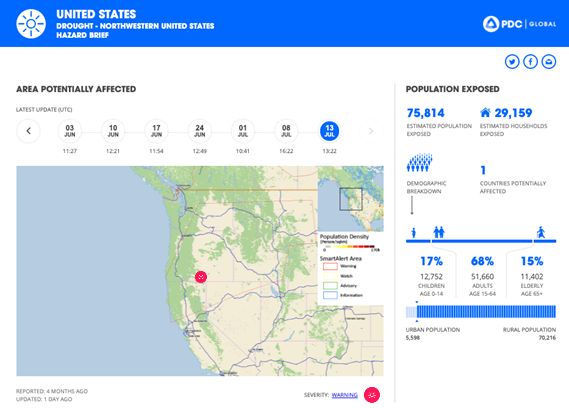
The More Information button opens a report-style view of the exposure and impact information from the Brief panel in a new tab. This view presents the information in a clean, printable format.


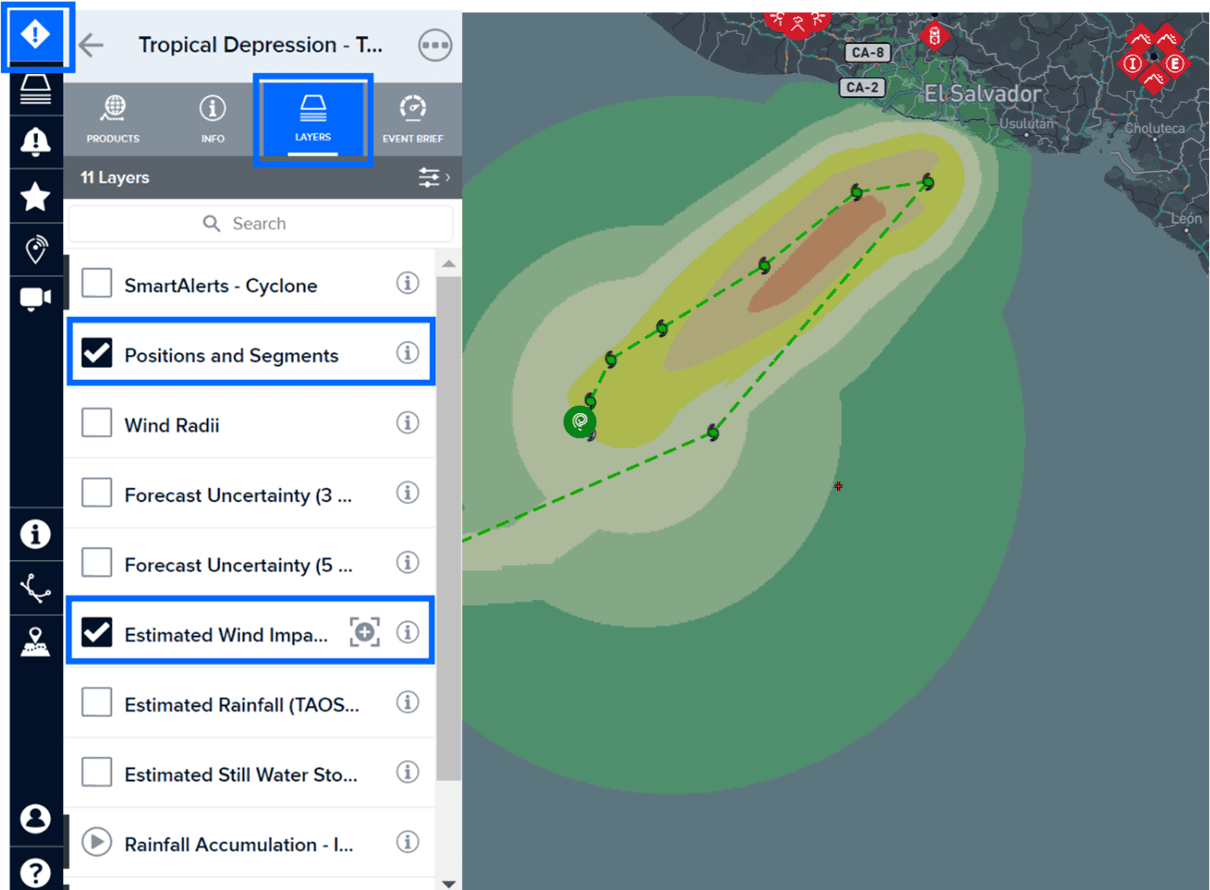
Click the Associated Layers heading to expand the section and access a selection of relevant data for the selected hazard type. Check the box next to a layer to display it on the map. To view more details about a layer, click the Info (i) button on the right.
The Exposure Summary provides preliminary information on the estimated number of population and households potentially exposed, including the number of countries affected and capital exposure (in US Dollars).
View the Demographic Breakdown for detailed information on the number of children, adults, and elderly potentially exposed. Click Enable Layer to display the population data on the map.
 |
After clicking Enable Layer, you can filter the population data displayed on the map by individual categories—Children, Adults, or Elderly—or by any combination of those categories (e.g., Children and Elderly). Simply check or uncheck the boxes next to each category to update the map view. The map will automatically refresh to reflect your selection. |

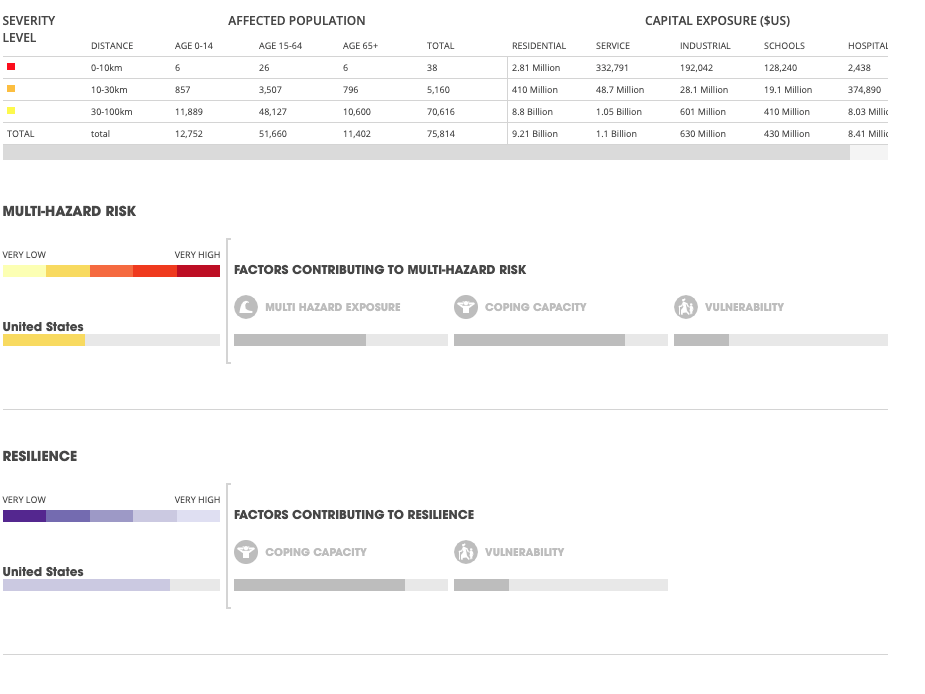
Exposure Detail by Severity provides a summary of the exposed population and capital, organized by the severity of potential impacts. It includes a breakdown of the exposed population by age group for each severity level, along with the estimated replacement value (in U.S. dollars) of exposed infrastructure and critical facilities by type (e.g., schools, hospitals, airports, seaports, etc.).
Note: The exposure layer for the selected hazard is enabled by default when the Brief panel opens. Select Disable Layer if you no longer wish to view it on the map.
Under Critical Infrastructure, you can view the number potentially exposed by type, as well as their locations on the map. Select Enable Layer to display these layers. To manage which types of critical infrastructure are visible, check or uncheck the boxes next to each category. Select the Disable Layer option to remove all critical infrastructure layers from your map.
Note: While all critical infrastructure locations for the enabled layer (e.g., Airports) will appear on the map, the count next to the layer name in the Critical Infrastructure section shows only those exposed to the hazard.
A Description of the hazard (depicted in the image above) is available near the bottom of the Brief panel. This AI-assisted description is generated using a combination of authoritative sources, along with PDC’s advanced analytics and models.
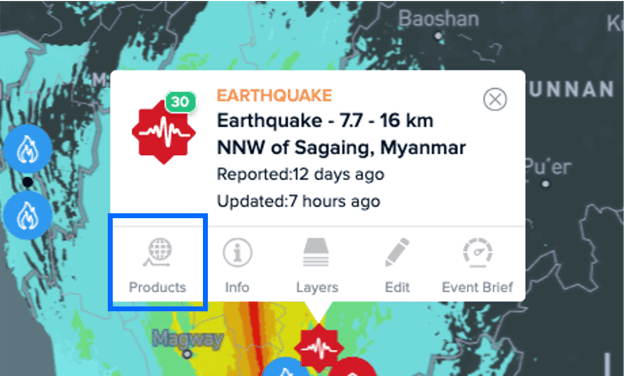
Products quick link
 |
The Products quick link provides access to a variety of reports, custom maps, analyses, and other information shared by multiple agencies. Below is an example of product types: |
-
Situational Awareness Products (for specialized maps, analyses, and modeled impact assessments)
-
Situation Reports (for detailed agency updates on the situation on the ground)
-
Damage and Needs Assessments (for information related to damage and needs)
-
Reference Maps (for response and recovery planning)
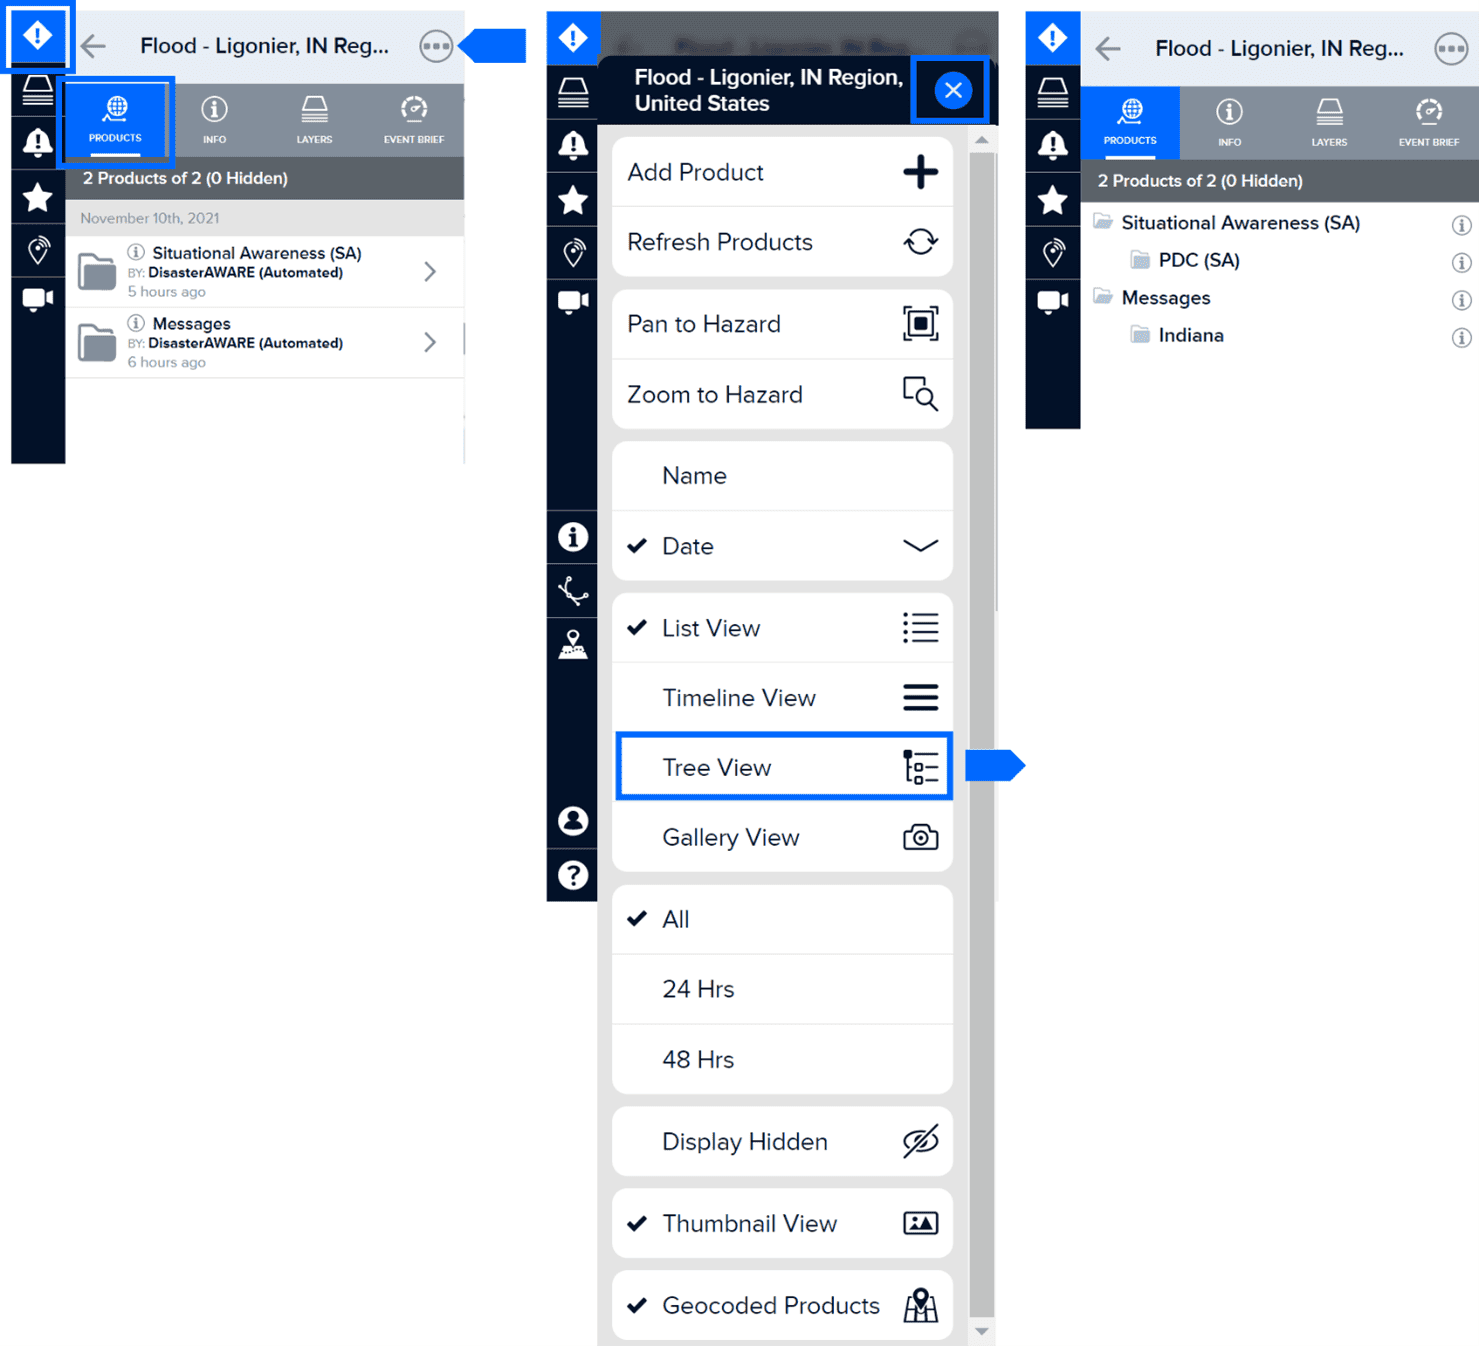
By default, products are listed and grouped by category, then organized into subfolders based on the organization that authored them.
|
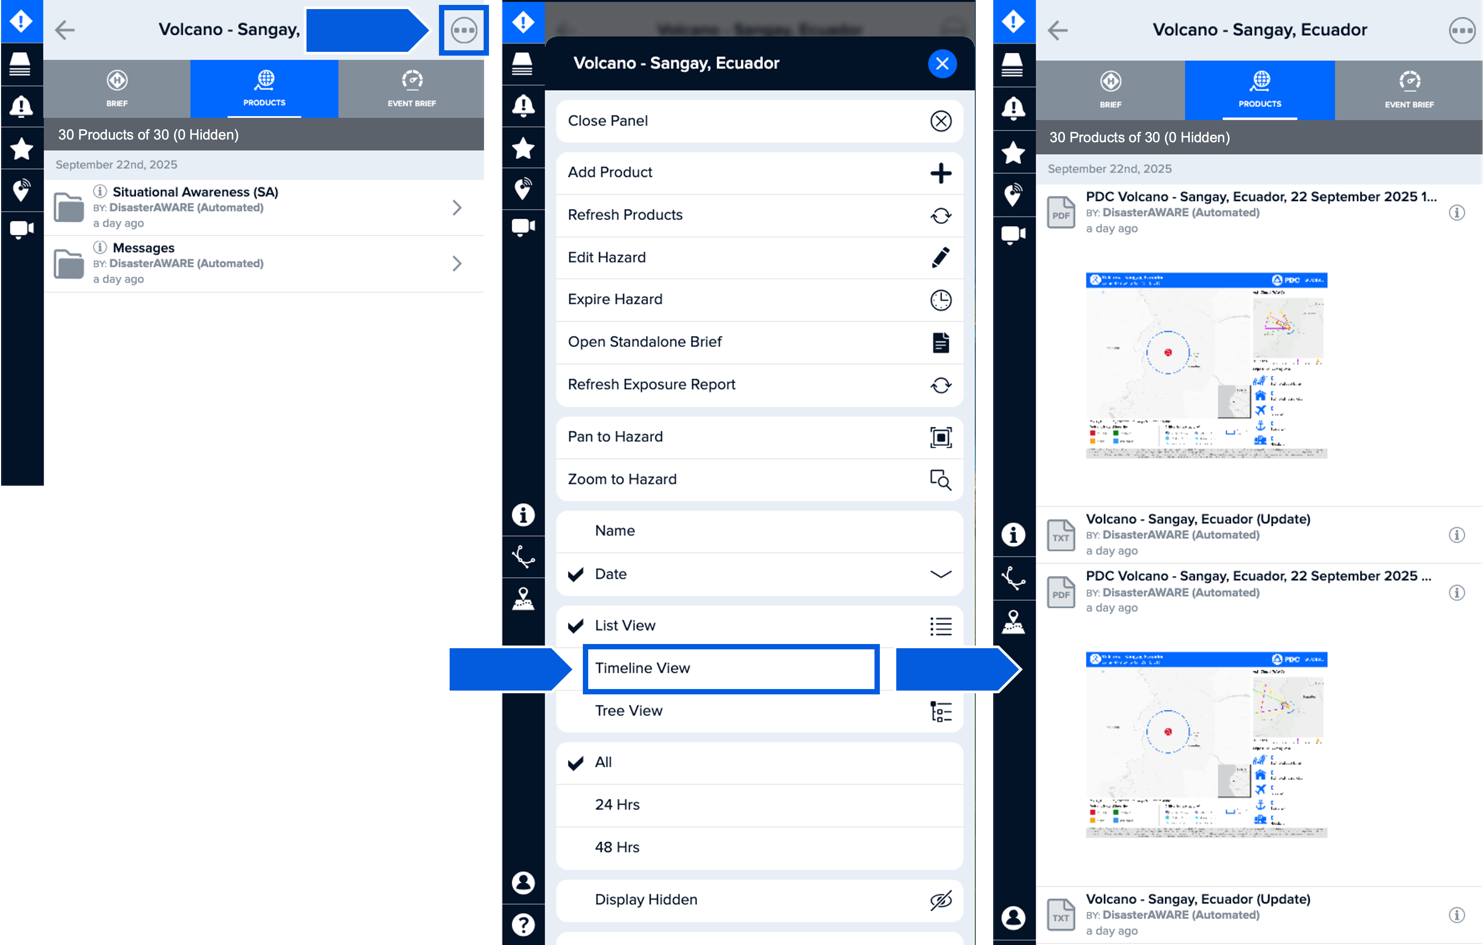
The Products list is set to automatically check for new products and updates every hour. However, you can manually refresh the list by selecting the Product Settings [ . . . ] at the top of the product panel and clicking Refresh Products. |
You can also adjust how products are displayed—such as List View, Timeline View, or Gallery View—by clicking the Product Settings [ . . . ] icon. This provides access to several options, including sorting by Name or Date, and filtering to show all products for the hazard or only those added within the last 24 or 48 hours.
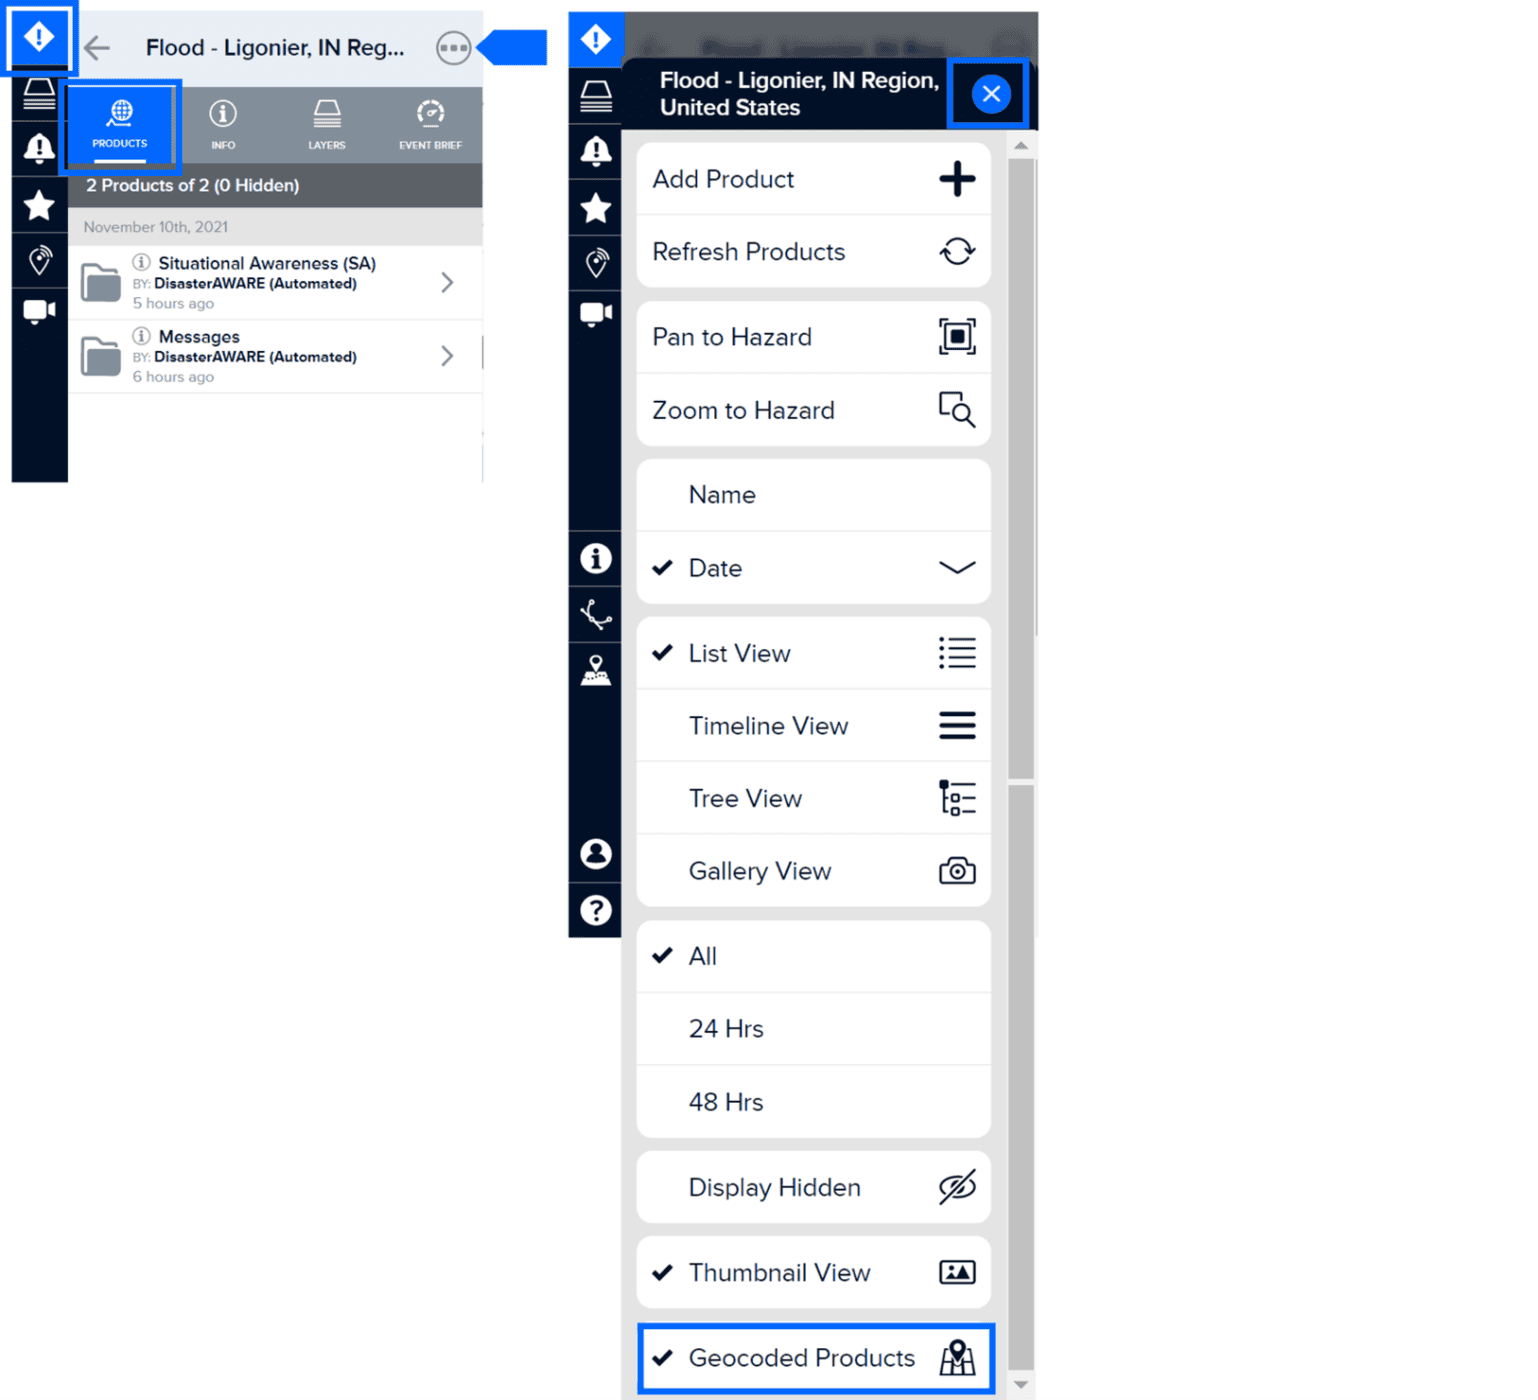
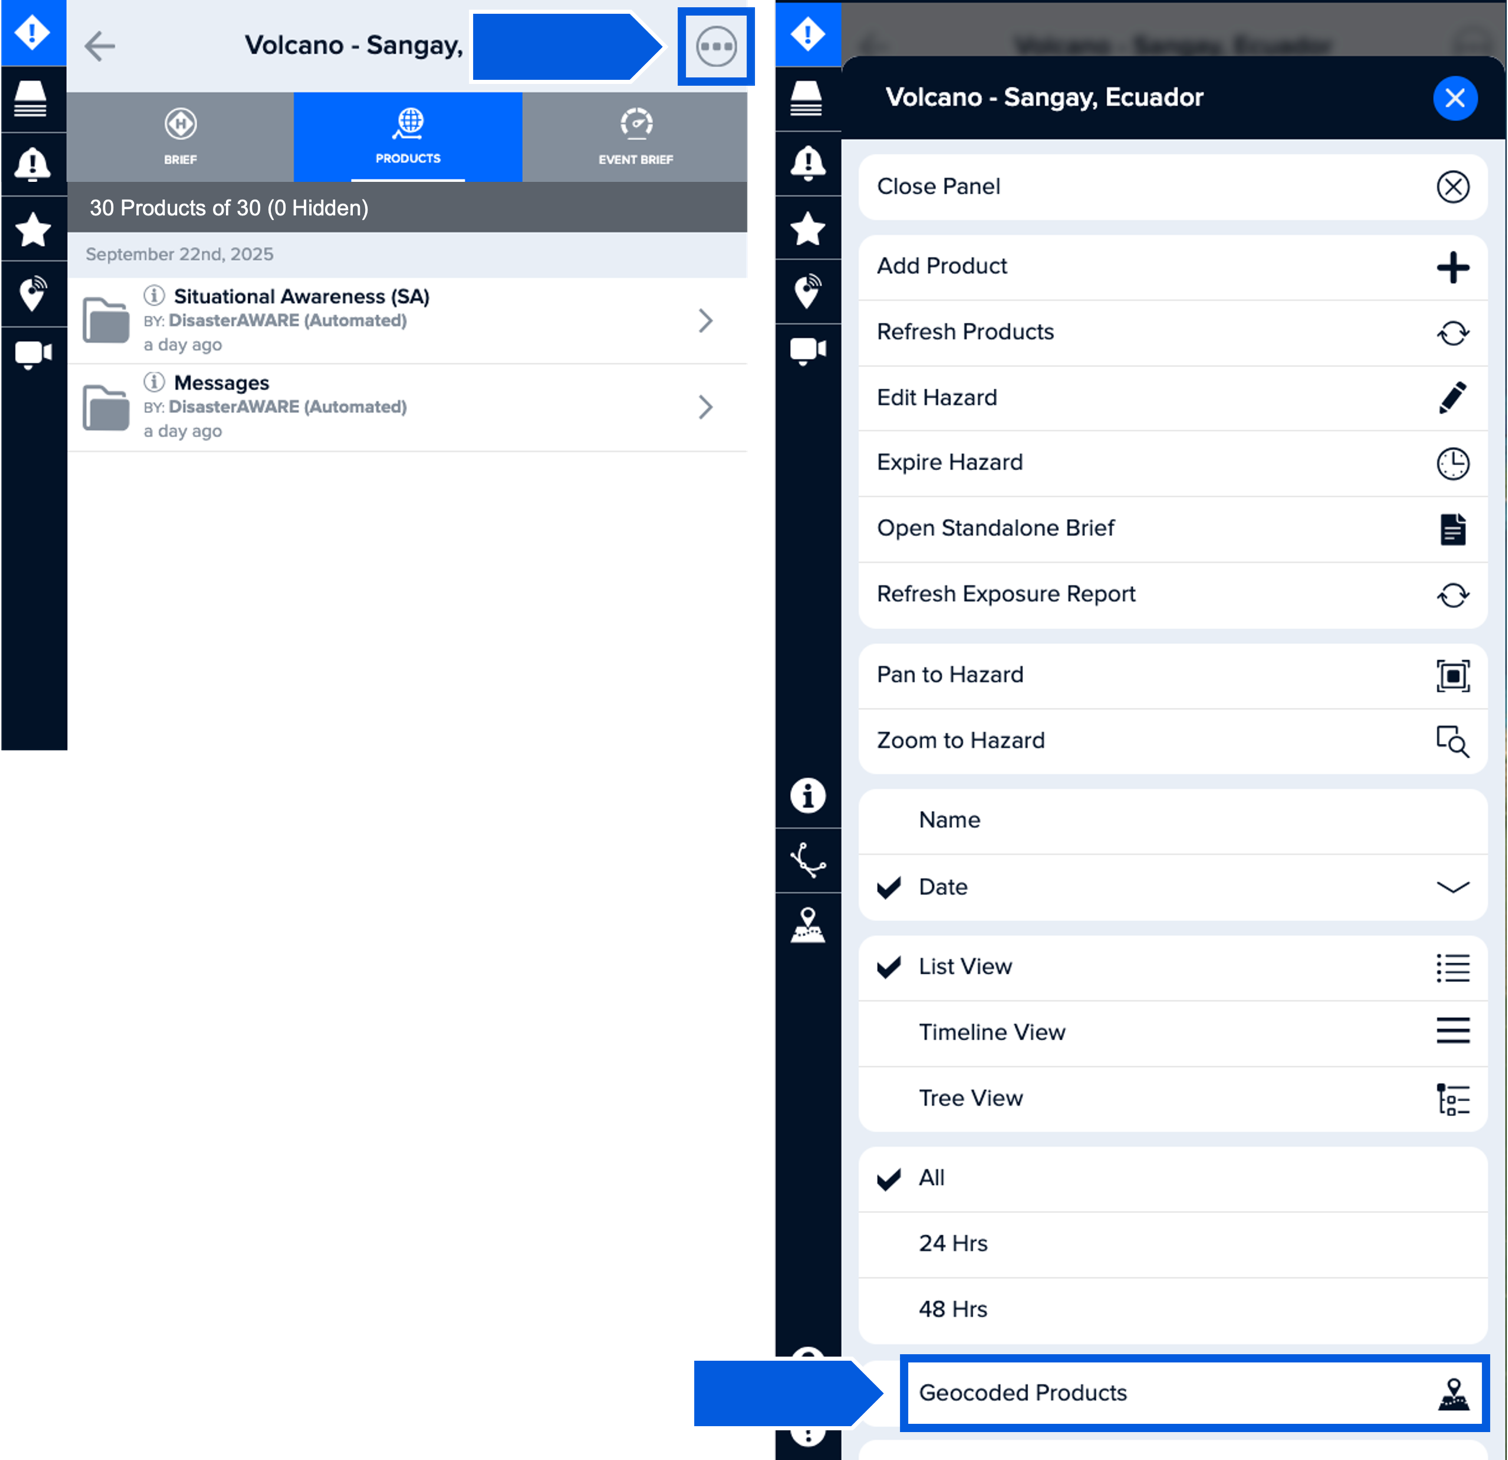
In these settings, you can also turn on Geocoded Products to see products tagged with specific locations—so they’ll appear right on the map based on user-defined coordinates.
When products are geocoded, they automatically appear on the map, making it easy to identify them by location. To disable this feature, simply toggle off Geocoded Products in the Product Settings panel.
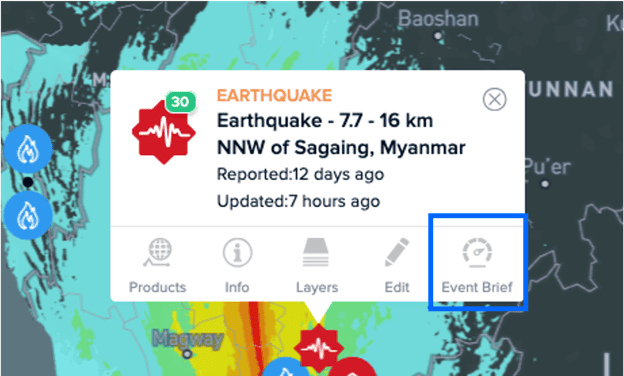
Event Brief quick link
 |
Event Brief provides expanded, life-saving information to support rapid decision-making and response during major hazards with potentially devastating impacts—such as population exposure, impacts to lifelines, and mass care needs. It helps anticipate hazard impacts and answers key questions like: |
-
What happened?
-
Where did it happen?
-
How bad is it?
-
What actions need to be taken?
For more information on Event Brief, see the Anticipate Hazard Impacts with Event Brief section.
Edit quick link
 |
Edit is available to Admin Users. Learn more in the System administration section. |