Dialog window

What is Event Brief?
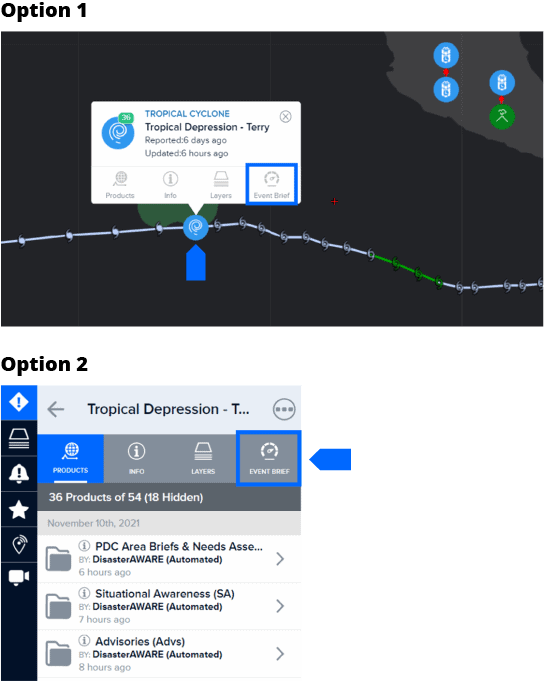
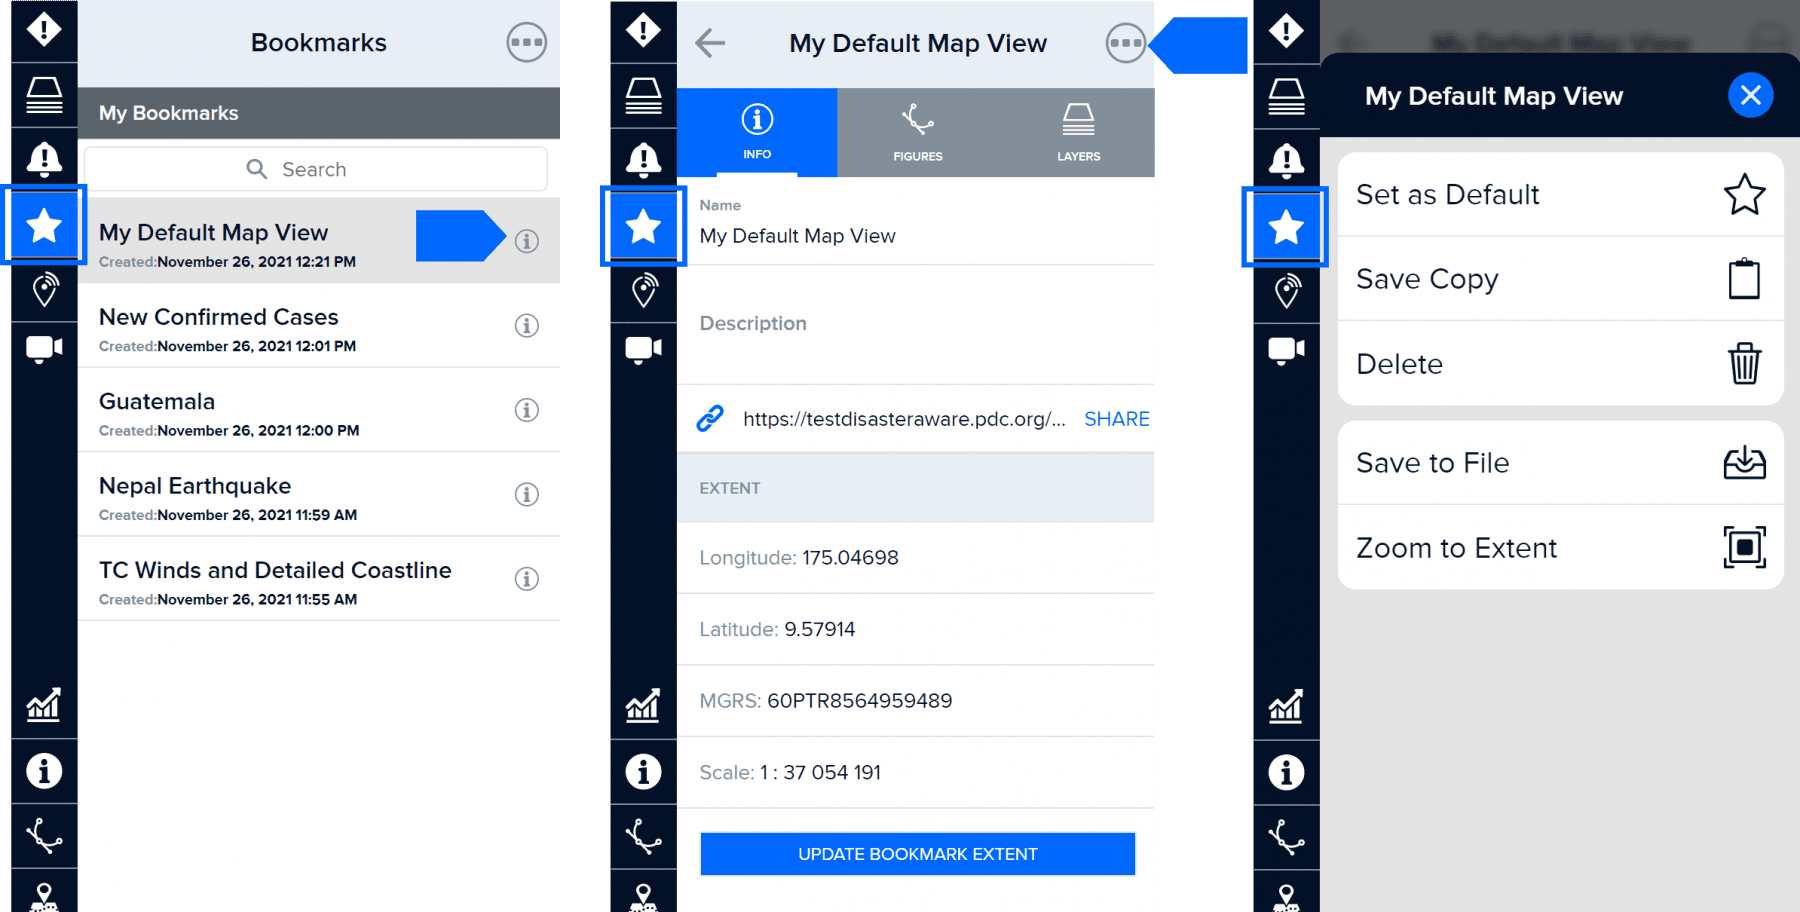
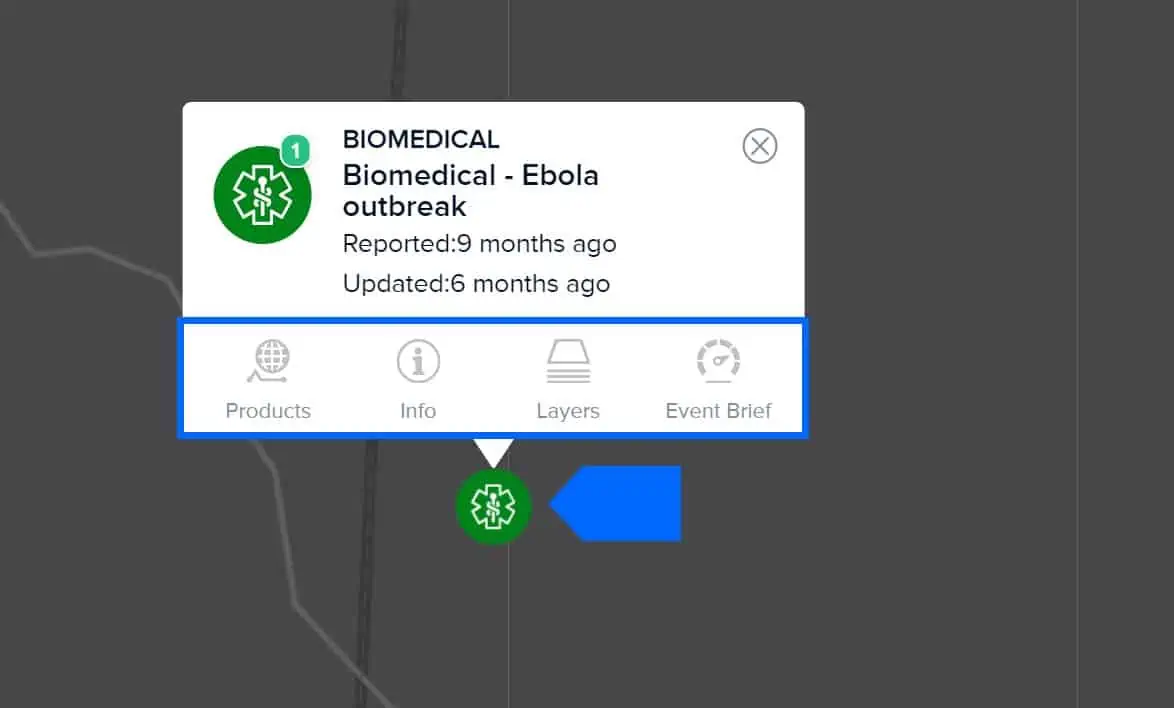
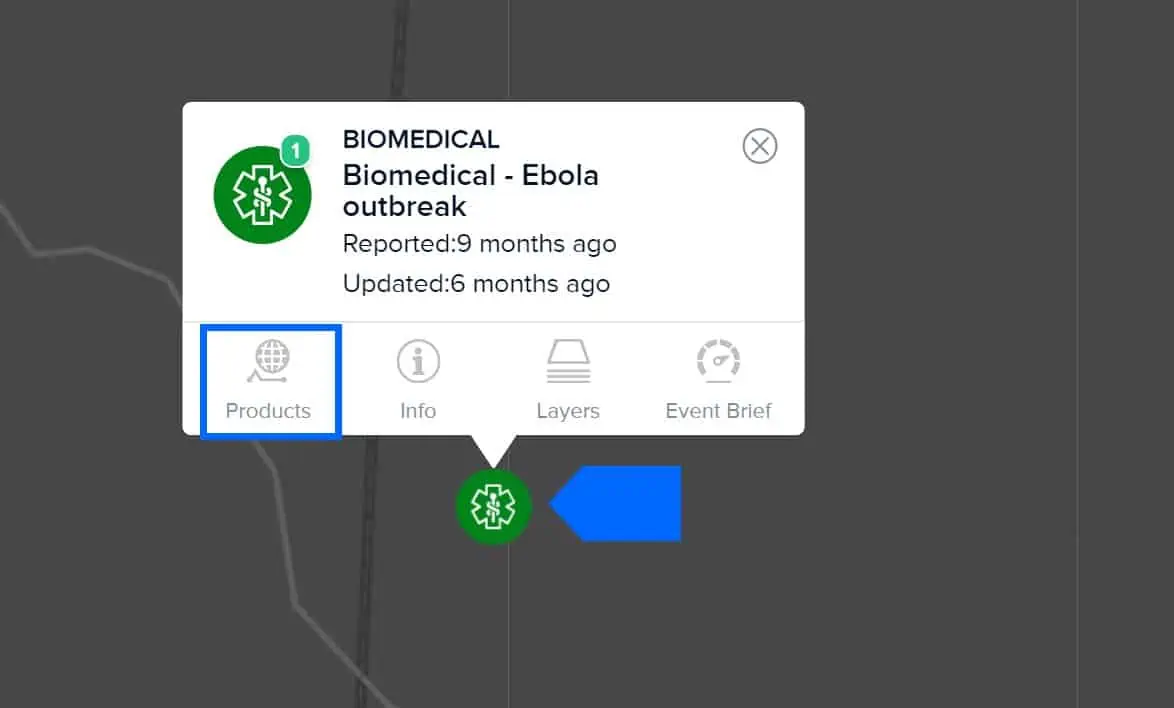
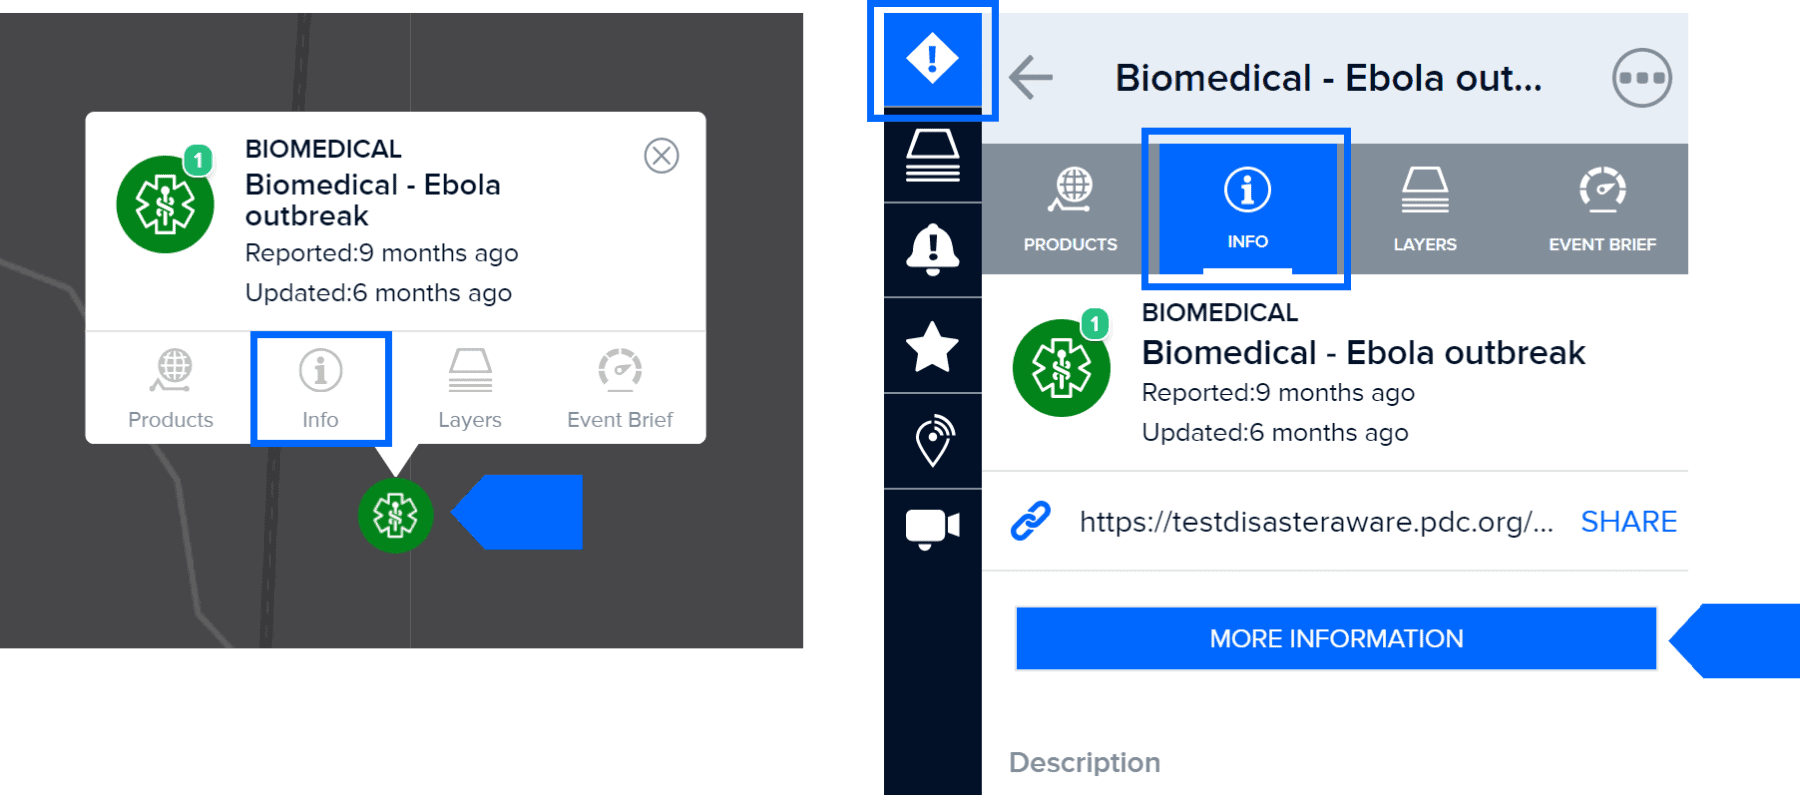
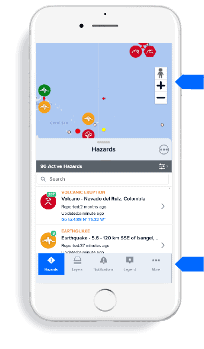
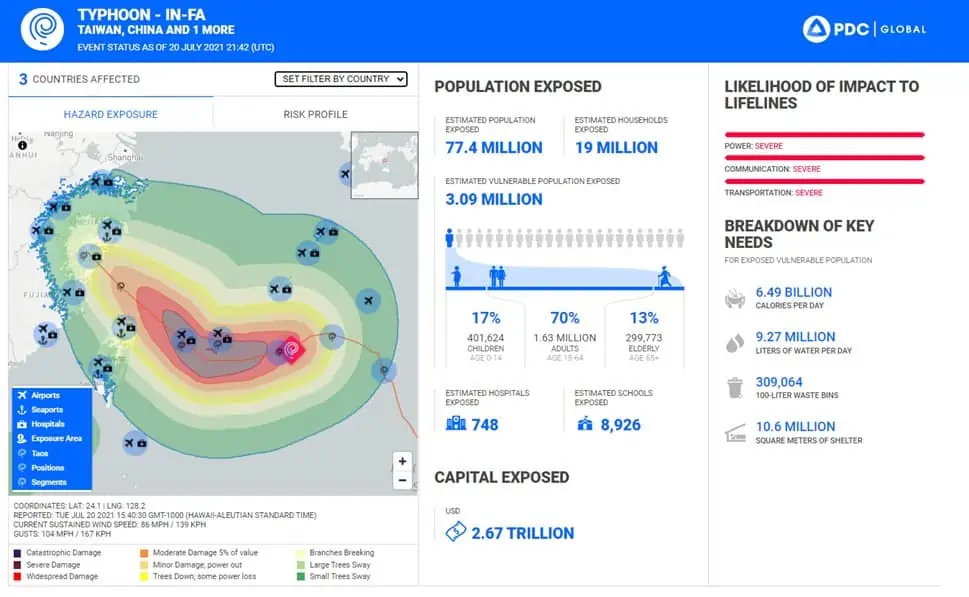
WHat is Event Brief?

Event Brief provides critical, life-saving information to aid rapid response during large-scale hazards that pose potentially devastating impacts. It helps anticipate hazard impacts and answer questions like: What happened? Where did it happen? How bad is it? What actions need to be taken?

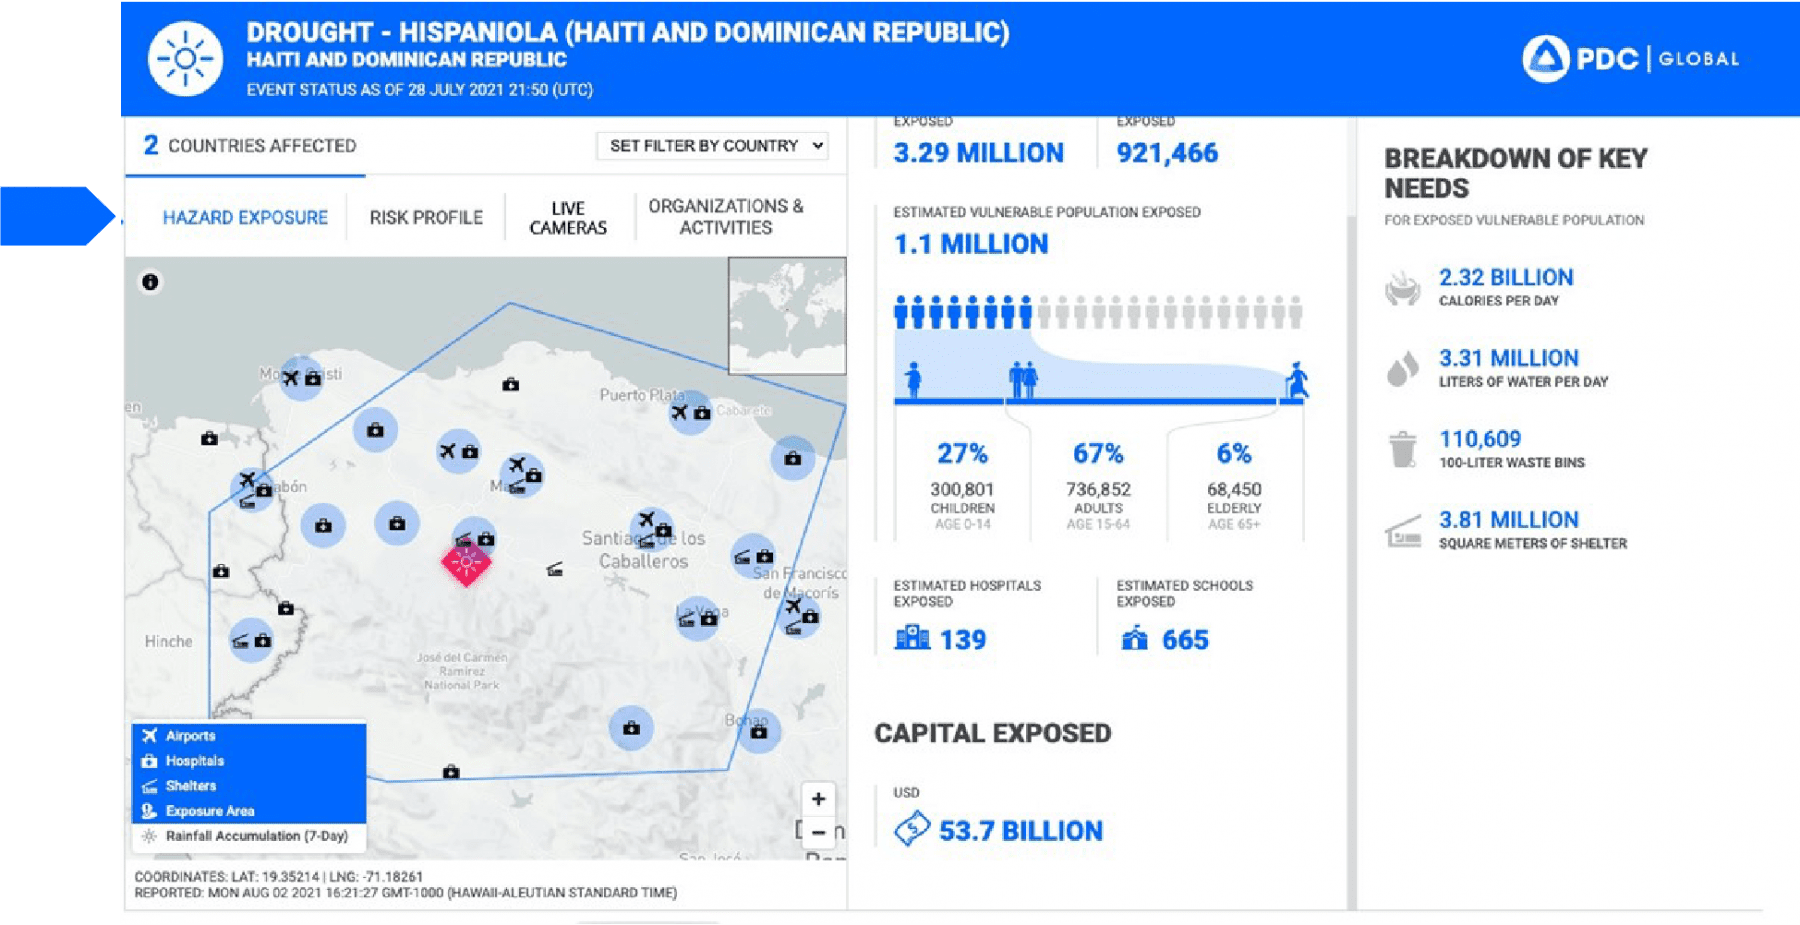
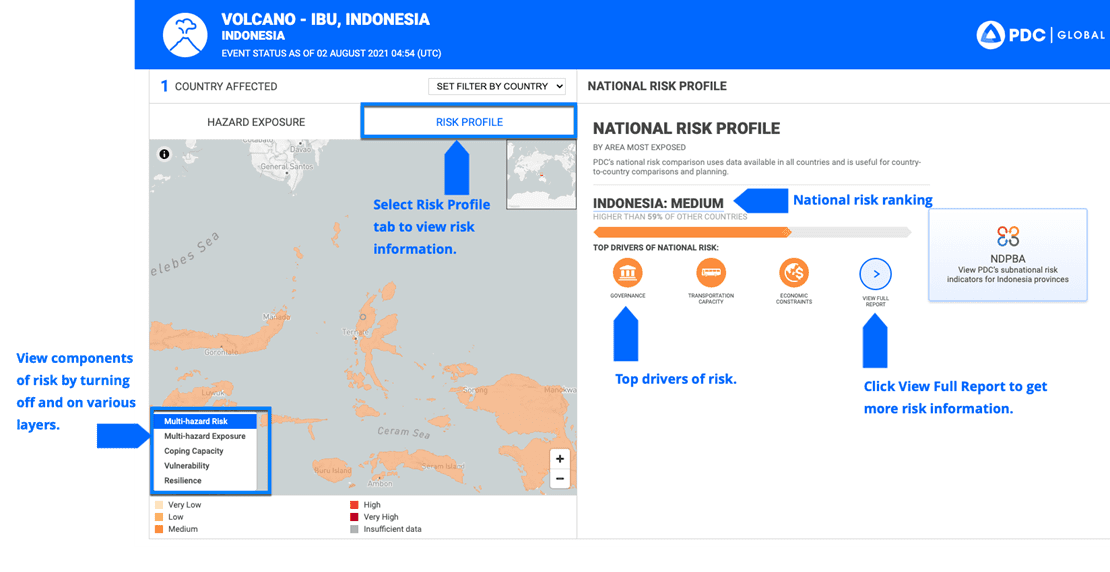
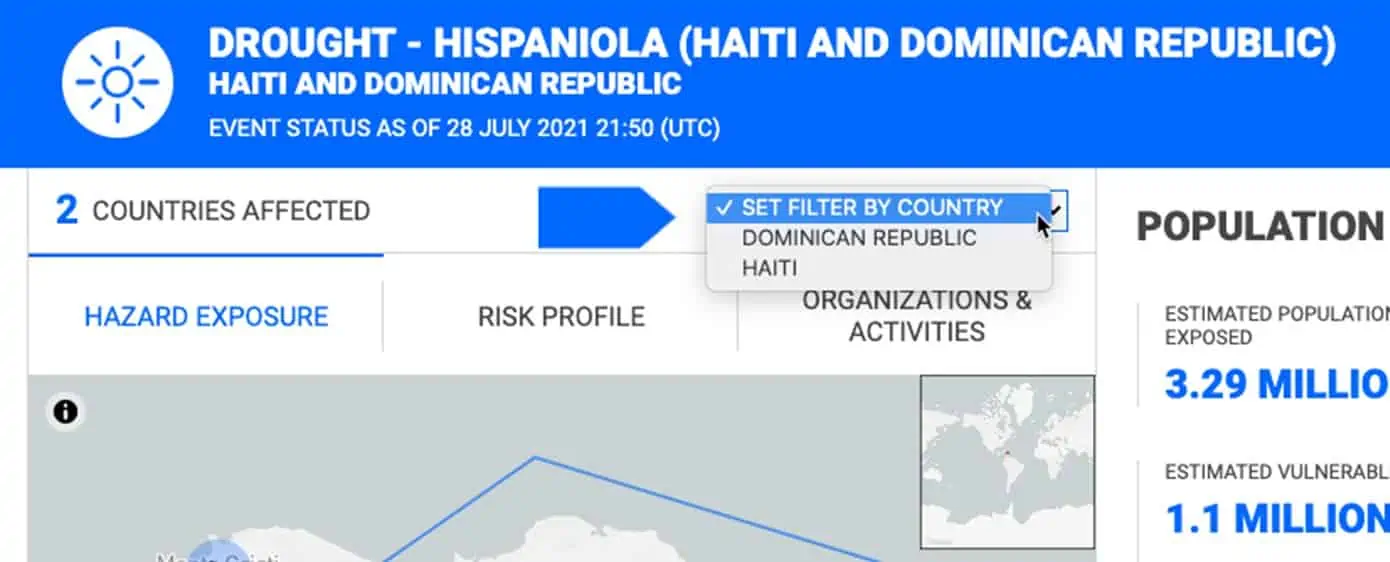
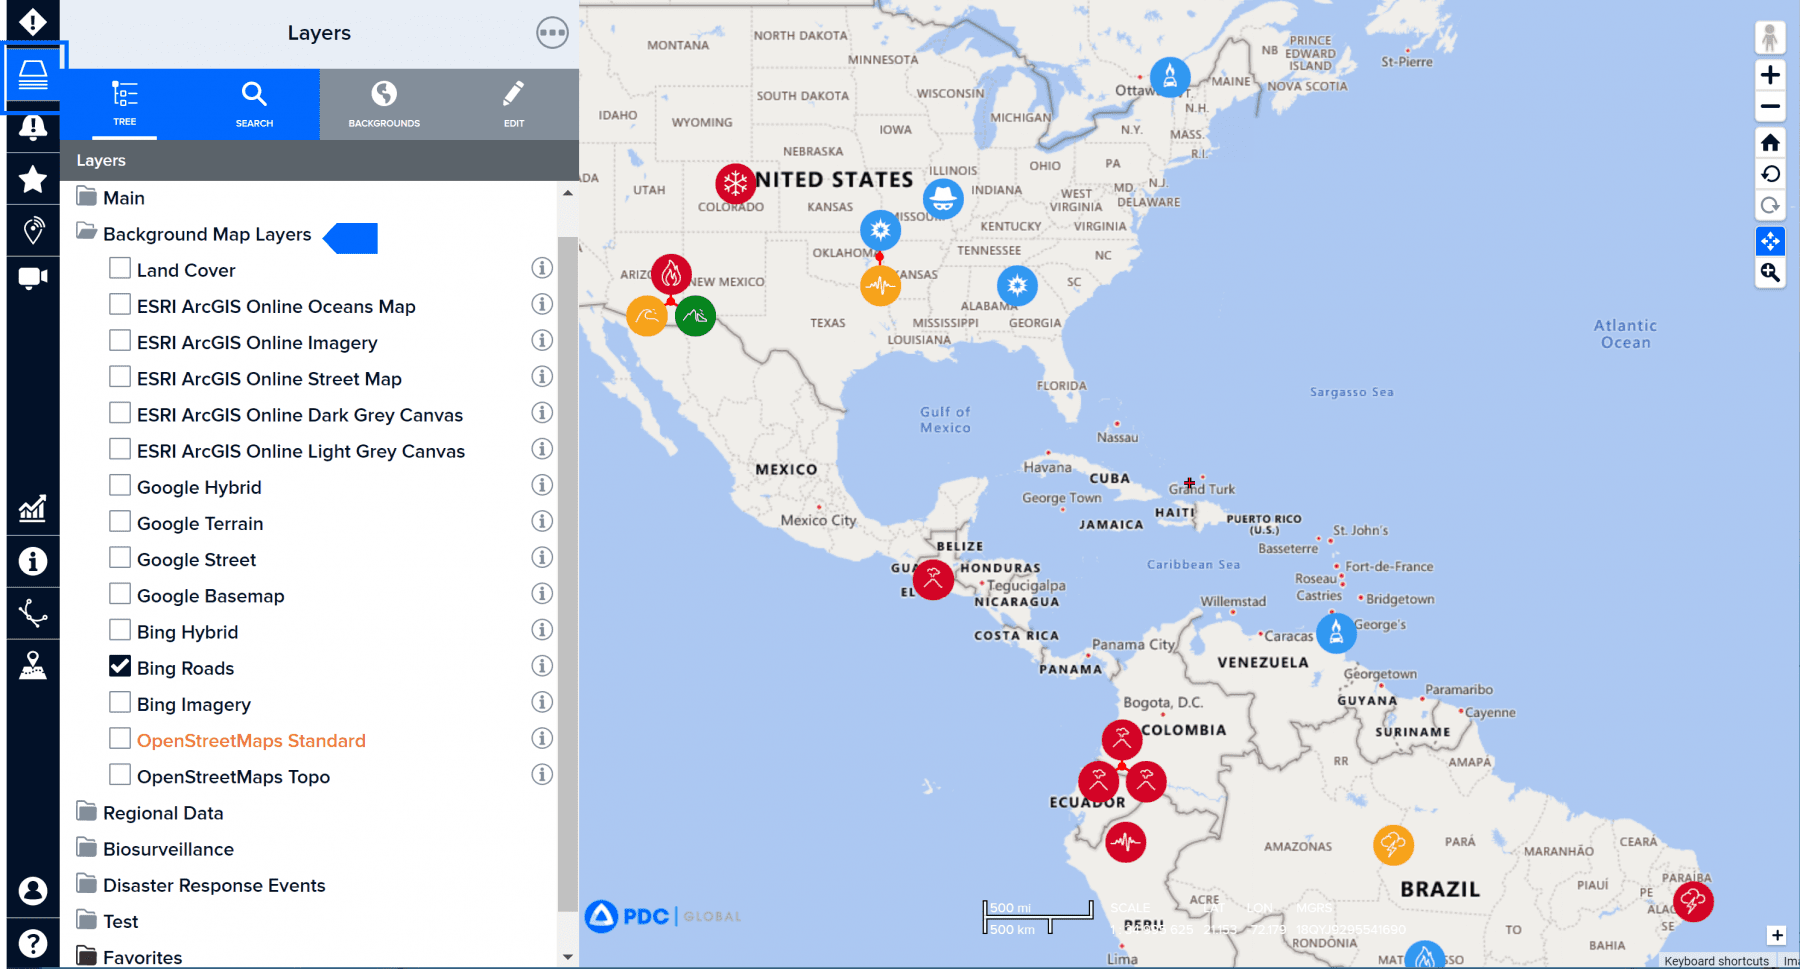
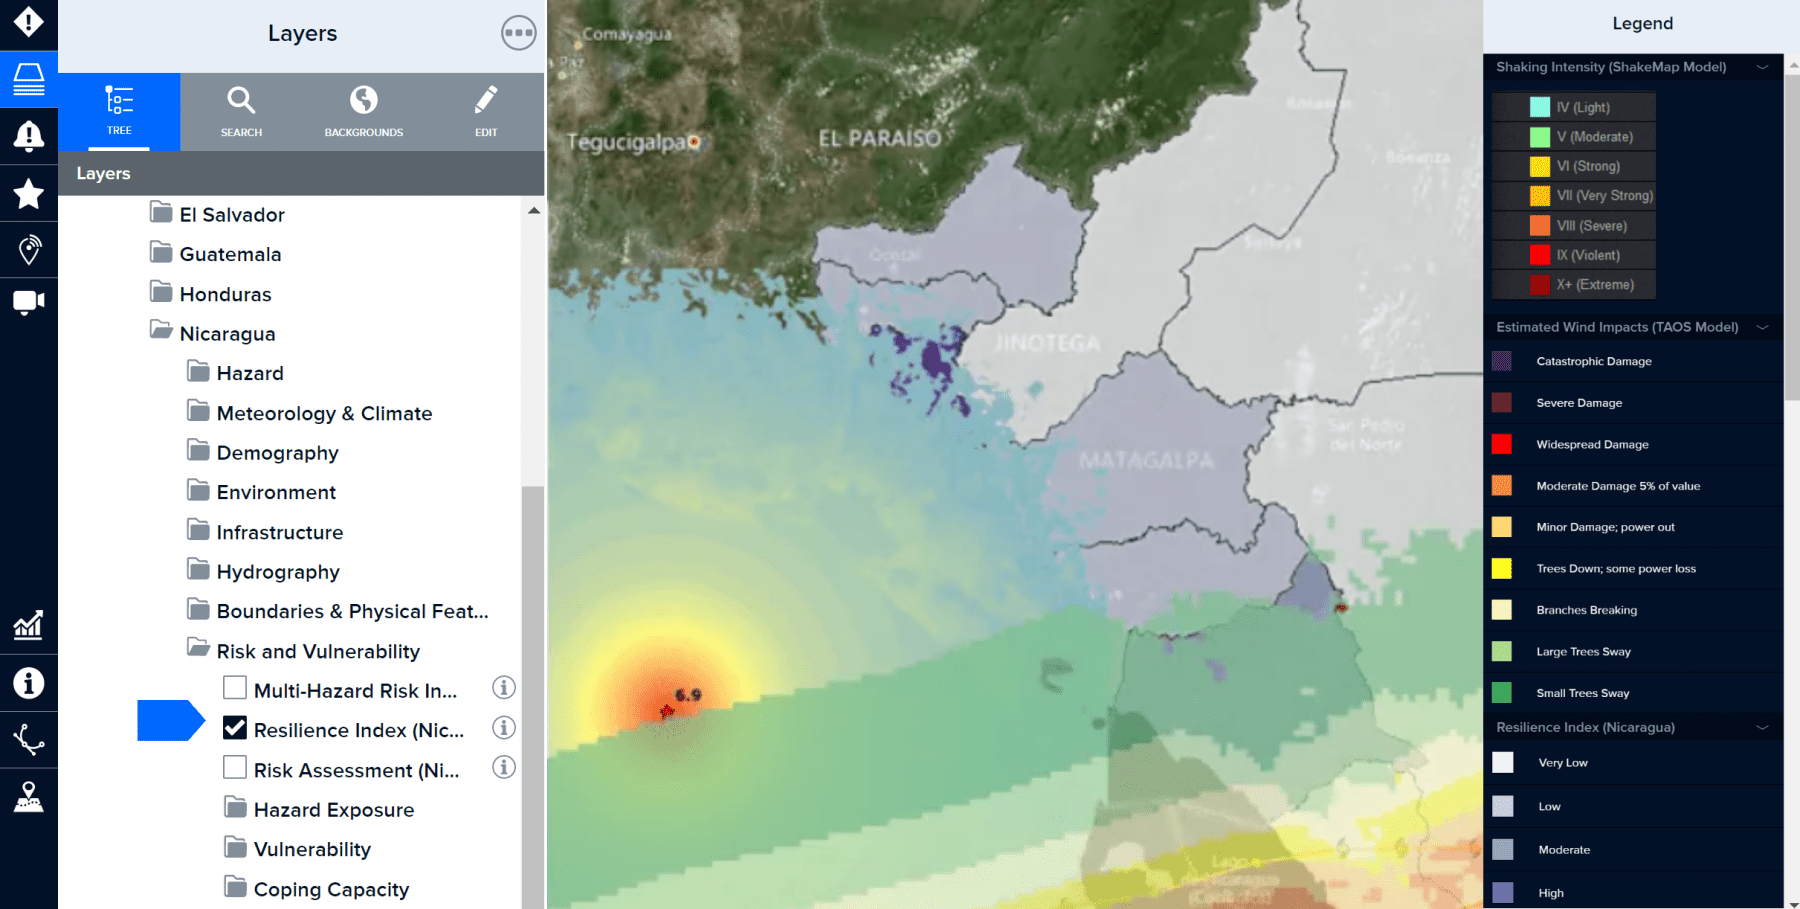
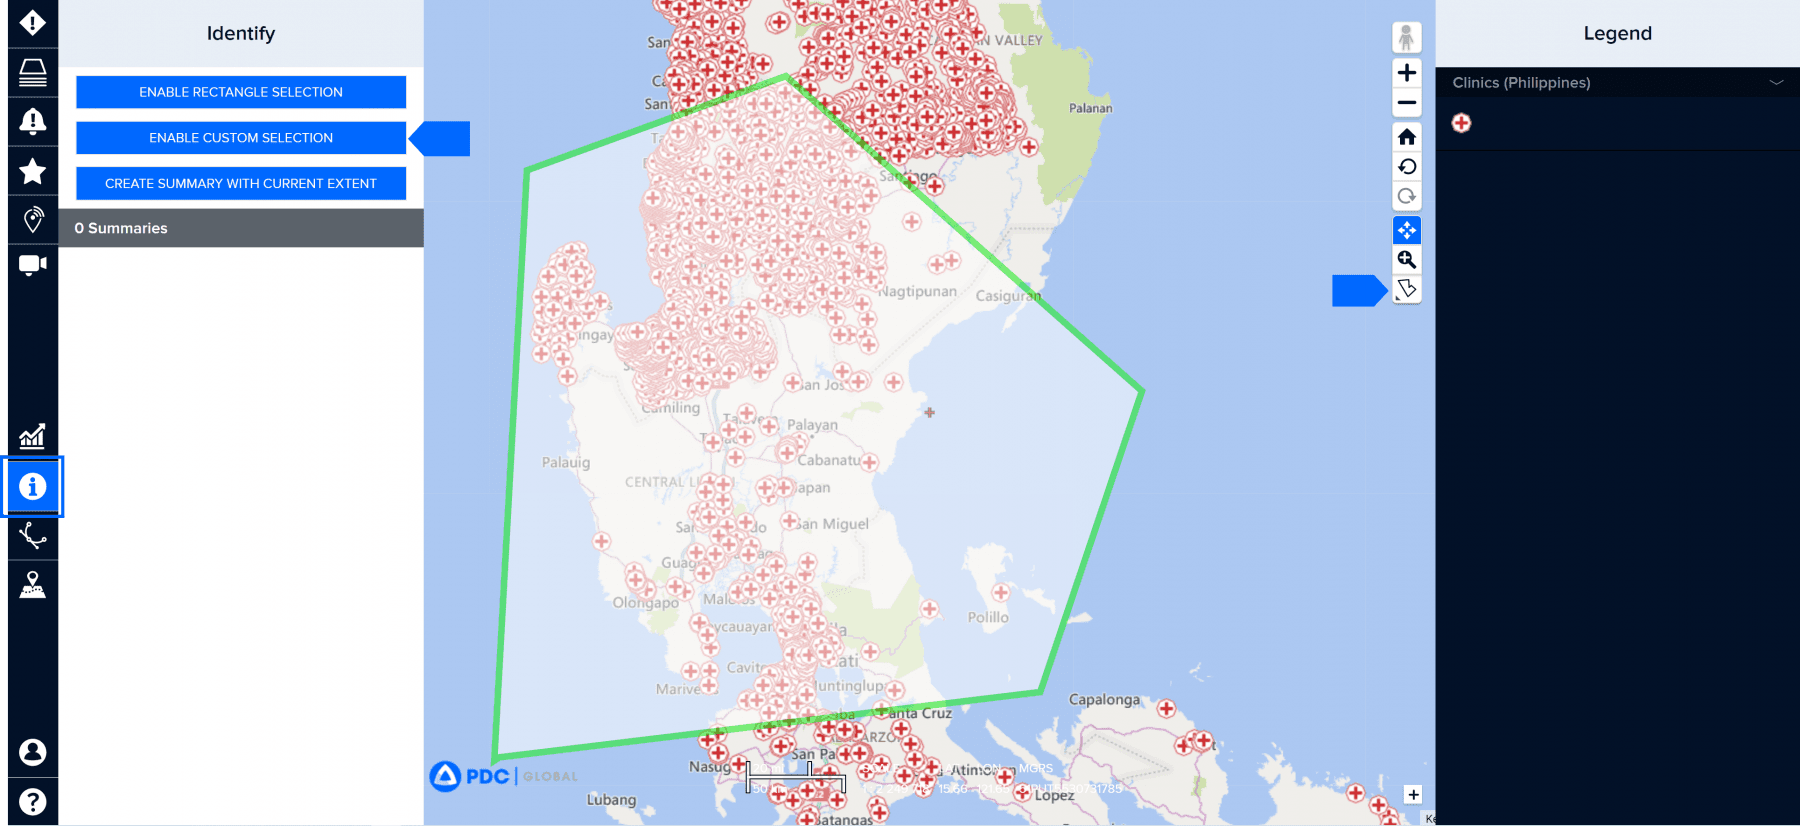
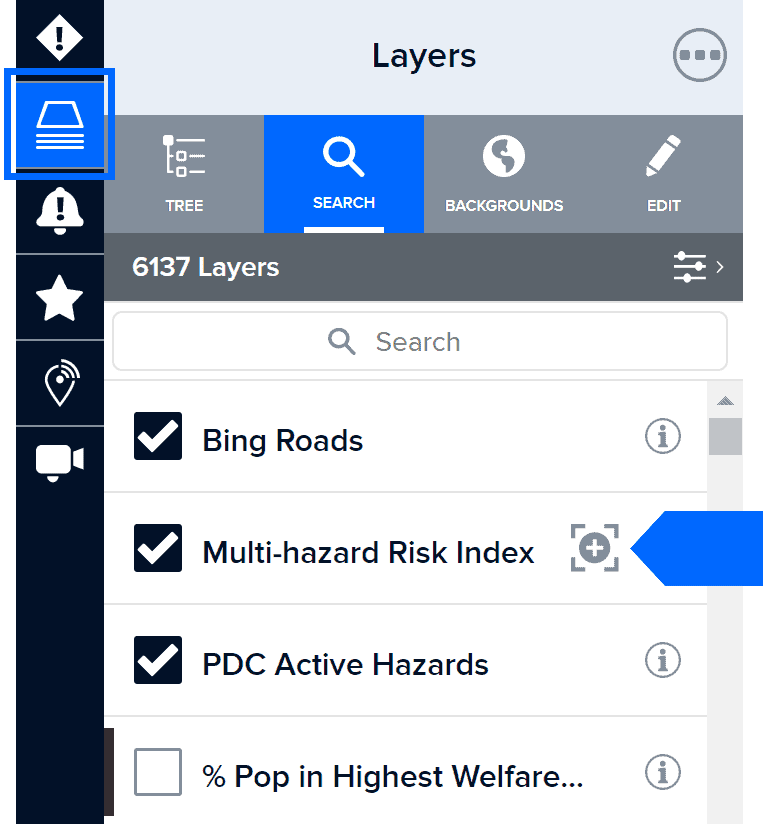
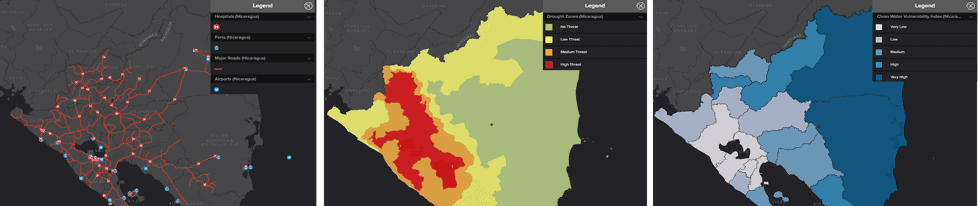
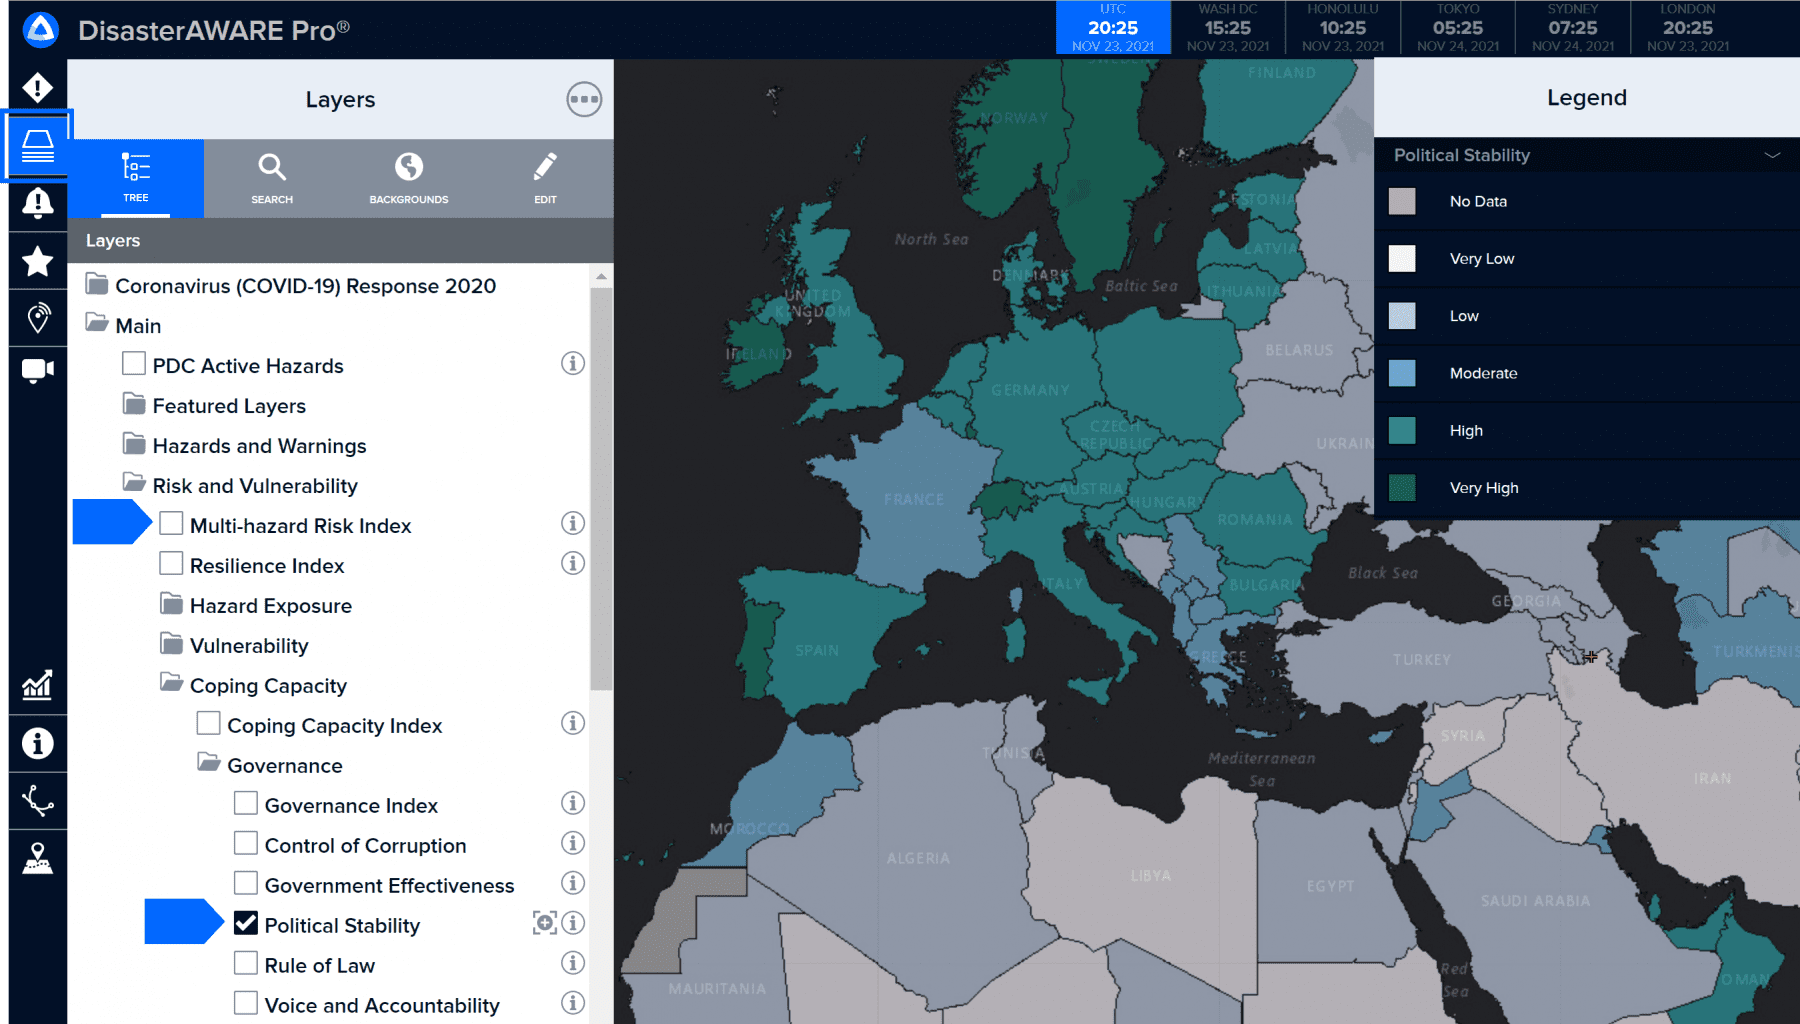
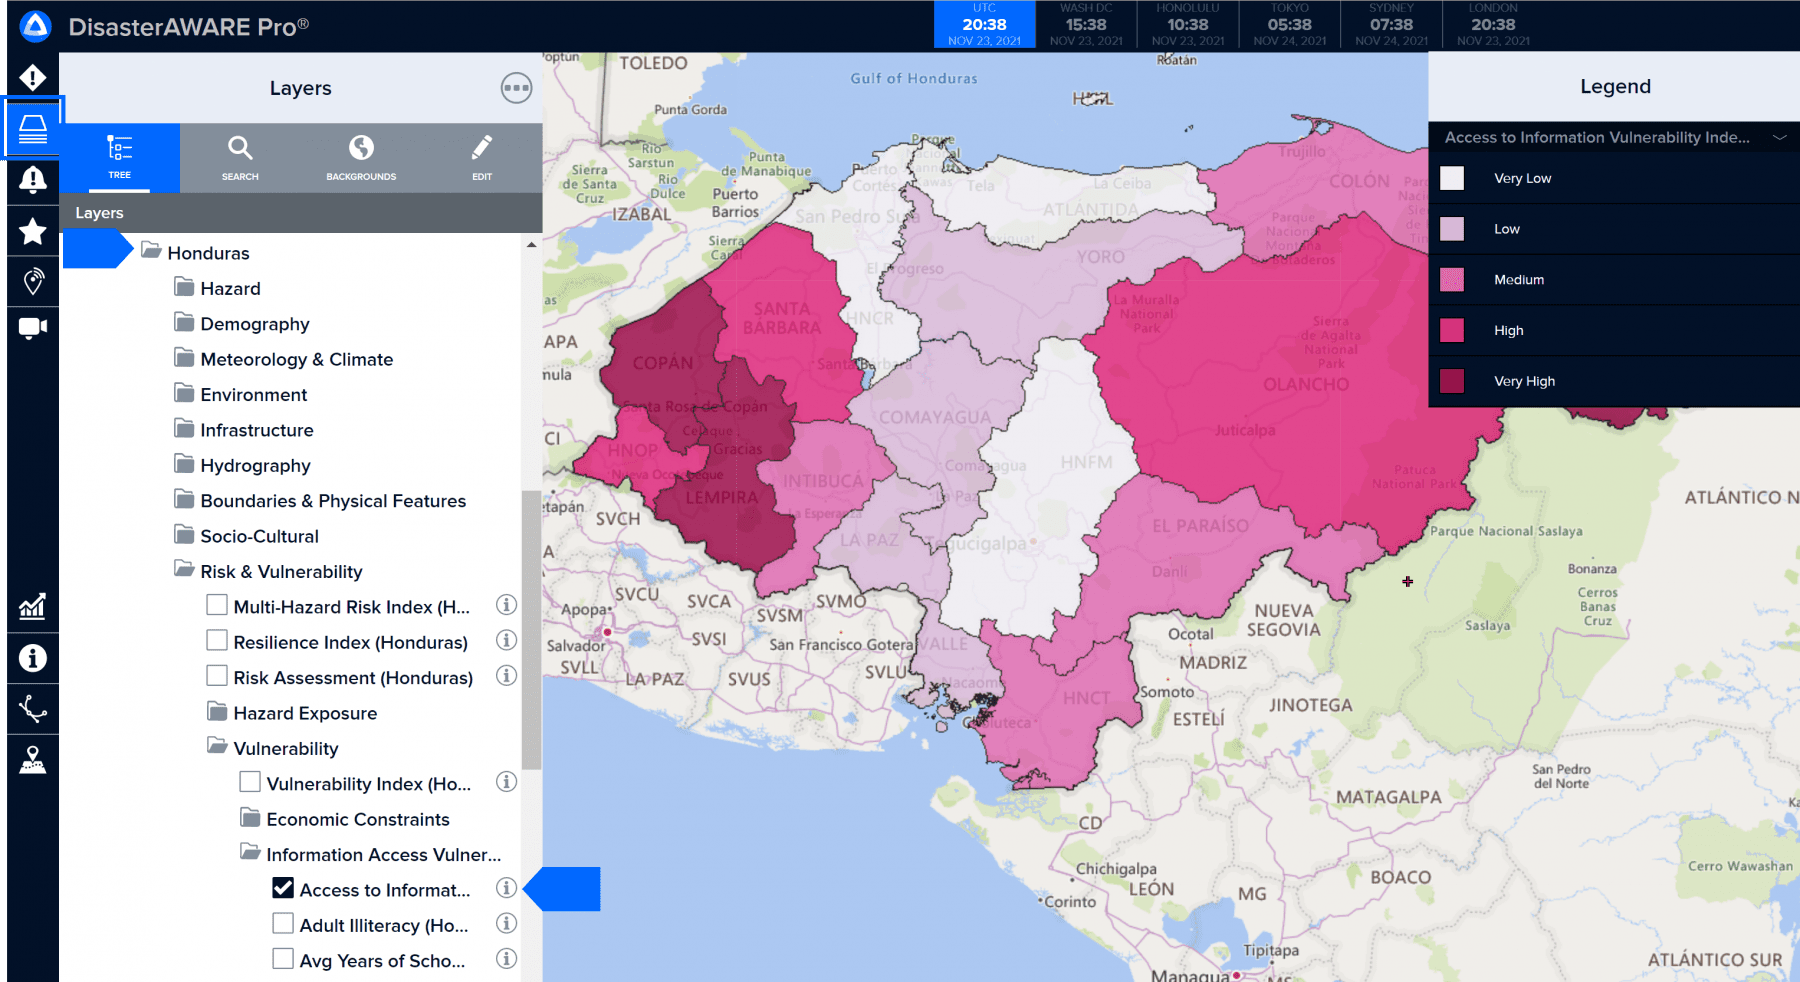
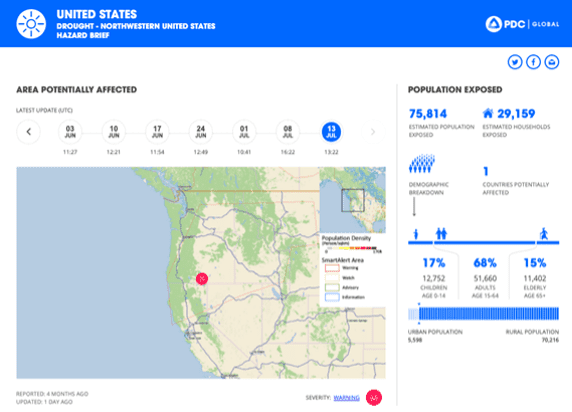
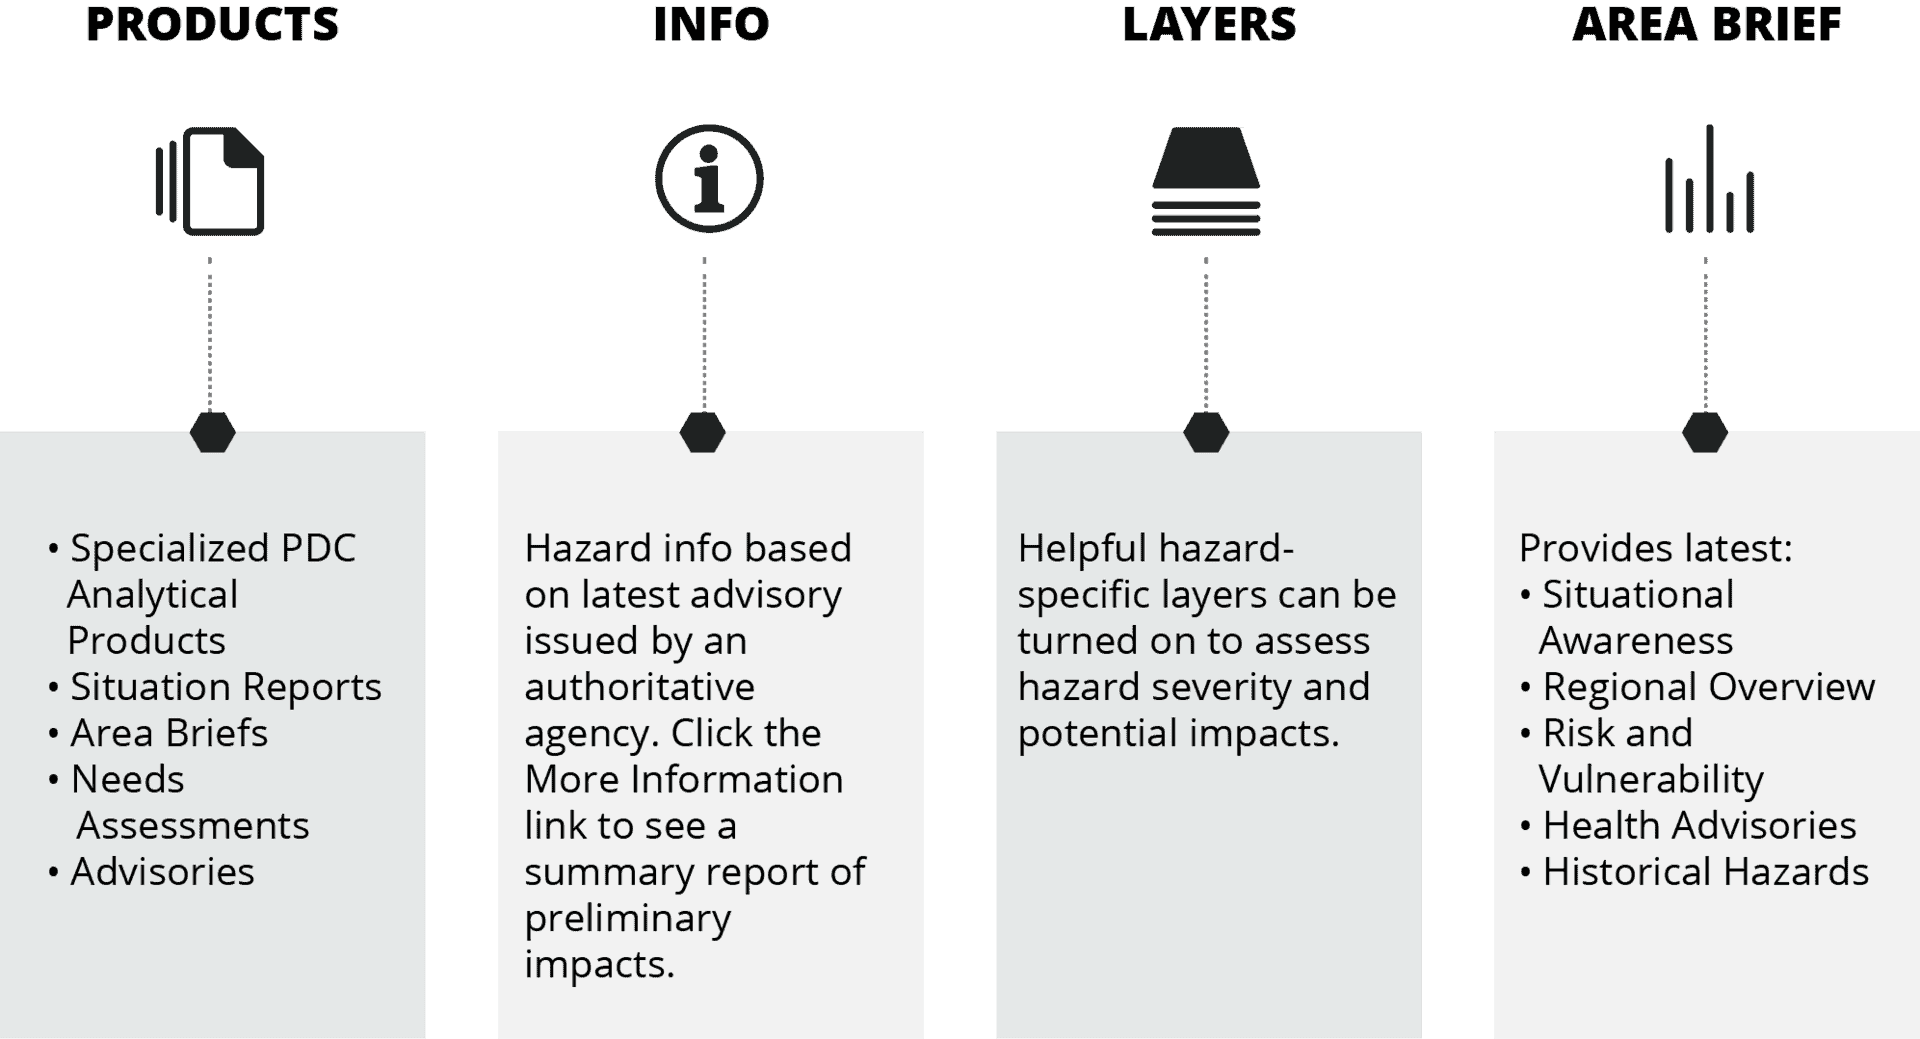
For hazards that meet the Event Brief thereshold, you can gain quick and easy access to:

Estimated population exposure
Critical infrastructure and capital
Potential impacts to lifelines
Estimated humanitarian needs

How to access Event Brief
Option 1

Click a hazard icon hazard via the map and then click the Event Brief icon. The Event Brief report will open in a new tab within your browser and will automatically refresh every 60 seconds as new information becomes available.

Option 2

Situational Awareness Products (for specialized maps, analyses, modeled impact assessments)
Situation Reports (for detailed agency updates of the situation on the ground)
Damage and Needs Assessments (for information related to damage and needs)
Reference Maps (for response and recovery planning)

Hazard exposure tab
Hazard Exposure tab

The Hazard Exposure tab is activated by default when you first load an Event Brief. When you navigate between tabs, the map and the supporting information changes to reflect the subject of the tab.

Risk Profile tab
Risk Profile tab

Event Brief provides national and subnational risk information to support strategic planning.

Note: subnational risk information is only available for select countries.

Select the Risk Profile tab to view national risk rankings and top drivers of risk for impacted areas. You can filter various components of risk (vulnerability, coping capacity, multi-hazard exposure) and more by using the bottom left menu to toggle data layers off and on.

Select the View Full Report option to access more detail about a nation’s risk ranking.

Filter results by country

By default, Event Brief displays estimates for the entire geographic area affected by a hazard. If there is more than one country affected by a hazard, you can filter information based on single country. Click the Set Filter by Country dropdown.

Subnational risk information

Event Brief offers subnational risk information for select countries, with subnational risk data for approximately 20% of the globe. This information is provided exclusively through PDC’s National Disaster Preparedness and Baseline Assessment (NDPBA) program.

To access subnational risk information, select the NDPBA for a particilar country.

Note: This button appears for countries in which data is available at the subnational level.

Subnational risk data appears in the map with a summary of subnational administrative breakdowns to the right. Select View Full Report for details on what is contributing to risk in a particular administrative area.

Live cameras tab
Live cameras tab

To get a picture of what is happening on-the-ground, select the Live Cameras tab. You may see black points on the map which represent individual camera locations. Numbered points indicate clusters of cameras.

Zoom in or click on a cluster to view individual camera locations.

Click on an individual camera point to view it to the right of the map. You can view up to 4 cameras at once.

Select one of the smaller camera images/videos for a larger view.

Pin cameras to their desired position by selecting the PIN button.

Remove cameras by selecting the X button.

Organizations and activities tab

The Organizations & Activities tab allows decision makers to quickly identify humanitarian and other organizations operating in the affected area in order to facilitate greater coordination between groups.

Latest weather updates
Supplemental Information
Latest weather updates

The Hazard Exposure tab provides the latest weather updates for the impacted area. This is especially useful for determining if inclement weather may adversely affect exposed populations and/or relief operations.

Note: Both imperial and metric conversions are available.

Situational awareness products
Supplemental Information
Situational awareness products

The Hazard Exposure tab provides quick access the latest situational awareness maps and products shared by PDC and other partners. Click on a product thumbnail to view or download and enlarged version.

Event history
Supplemental Information
Event history

Access historical event details while on the Hazard Exposure tab to help you compare information about similar events that have impacted the same area.

Note: The event with the largest ‘Total Affected’ population will be highlighted.

Travel and health advisories
Supplemental Information
Travel and health advisories

Travel and health advisories are provided on the Hazard Exposure tab to support response and planning for the impacted area. Select the blue paperclip icon to the right to download advisory details.

Top news stories
Supplemental Information
Top news stories

You can read the latest news stories about an event on the Hazard Exposure tab provided by major news outlets around the globe. Click on a story to access its full content.

D Prev
Next E

Dialog window

×

Questions? Contact Us.

Dialog window

Media hotspots
Media hot spots
Locate media hot spots

Increase your situational awareness about hazards through the latest media updates.

Click the Media icon from the left toolbar to see hot spots of media activity related to natural and manmade hazards happening around the world.

Zoom in closer to any hotspot to see the types of hazard articles reported within the area. You can use your mouse scroller, the “+” symbol on the right tool bar, or zoom selector.

Scanner
Media hot spots
Using the Scanner Tool

The scanner tool allows you to filter results as you drag the scanner radius over areas of the map (see below). You can resize the radius by clicking the small grey circle and dragging as shown here.

Although news stories are automatically refreshed every five minutes, you can click the three dots at the bottom of the Media panel and Refresh Stories to manually refresh at any time.

filter news articles
Media hot spots
filter news articles

To quickly filter news articles by topic, click the Article Tag Cloud shown above and select the keyword categories of interest. Then close the panel to see the filtered news stories.


filter news articles
Media hot spots
Additional FIlters

To apply additional filters to news stories, click the Settings icon in the Media panel. Filter by media type, location coordinates, or adjust keyword filters and click Done to apply.

D Prev
Next E

Dialog window

Change your default background map
Create Custom Maps
Change your default background map

DisasterAWARE comes with a variety of background maps that you can choose to make your default. Below are just a few examples.

Click the Layers panel from the left toolbar and open the Background Map Layers folder. Check the option for the map theme you’d like to have displayed as your background map.

Combine and mashup layers
Create Custom Maps
Combine and mashup layers

You can turn on multiple layers at one time to create a better understanding of potential disaster impacts.

Here are two layers depicting estimated exposure for a multi-hazard event that included a tropical cyclone and a simultaneous M6.6 earthquake intersecting with exposed populations in Nicaragua.

A third layer depicts disaster resilience which is useful for planning evacuations, response efforts, search and rescue, and delivery of humanitarian assistance in low-resilience areas. Learn more about layers in the section titled Layers to Support Situational Awareness.

Add drawings, text, and images to maps
Create Custom Maps
Add drawings, text, and images to maps

Drawing tools allow you to add your own content to the map and can help with preliminary damage and needs assessments, identification of staging areas, staffing and resources, measuring areas and distances, and more.

D Prev
Next E

Dialog window

Import asset to be tracked
MONITOR AND PROTECT YOUR ASSETS
Import your asset data

To setup asset protection, click the SmartAlert icon on the left toolbar and then click the Assets link.
Once the Assets panel opens, click the Add Assets tab.

Add a data source
MONITOR AND PROTECT YOUR ASSETS
Add a data source

Enter a meaningful name for the asset data layer you want to import and click the Source link. Next, click the Edit icon to begin the process of adding an asset layer to the system.

Data Source - part 2
monitor and protect your assets
Add a data source

Now click the Plus (+) symbol and add a web service URL for the assets layer you wish to import. If required, you can also add credentials needed to access the service by clicking the Authorization link.

Data Source Authorization
monitor and protect your assets
Data source Authorization

To add authorization credentials, click the Edit icon, then the Plus (+) symbol, and then enter the layer authorization details shown below. Authorizations will remain in the list for future use, should you wish to import other asset sources that utilize the same authorization. You can remove authorizations at any time.

View imported asset layers
MONITOR AND PROTECT YOUR ASSETS
View imported asset layers

Click the Layers icon in the left toolbar to view your list of layers.

The asset layer(s) you’ve added will appear under the User Layers folder along with any other data layers you’ve previously imported.

Get Alerts
Monitor and protect your assets
Get Alerts

Find out when assets are in harm's way.

D Prev
Next E

Dialog window

Identify Tool
Identify Tool
Using the Identify Tool

The identify tool allows you to view the tabular data associated with active layers.

With the active layers of interest turned on, click the Identify tool from the left toolbar. Next, choose from one of the three buttons shown to the left to select an area on the map.

Summary
Identify Tool
Summary report

After selecting an area on the map, you will see a Summary report listed in the Identify panel. Click the arrow located to the right of the Summary report to view data within the selected area.

Summary
Identify Tool
Summary Report Data

You will see the tabular data for the Summary report and expand the panel to see more columns. You can also zoom the map to a record within the data table.

D Prev
Next E

Dialog window

Live cams
Live cams
live camera monitoring

DisasterAWARE provides live camera monitoring and footage in select locations around the world. Live cameras help increase situational awareness of on-the-ground conditions and are a useful tool for disaster response and preparedness.

Zoom in closely to an area of interest and click the Cameras icon from the left toolbar. If cameras are available, they will be grouped on the map to depict the number available in an area, or displayed individually.

When you click a grouped camera icon, the map will zoom in closer and to show cameras at a closer proximity.

Select Active Cameras
Live cams
Select active cameras

Once zoomed in enough to view individual cameras, click one of the Camera icons on the map to enable the camera and view footage in the active cameras panel. You can also turn on cameras by selecting the Overview tab and checking the box in the list of cameras.

Enable multiple cameras
Live cams
Enable multiple cameras

You can enable multiple cameras by repeating the previous steps. To view the cameras you’ve enabled, click the back arrow or Active Cameras tab.

Note: Live camera feeds update at different intervals (some update every 10 seconds) depending on the provider and may or may not have date and time stamps.

D Prev
Next E

Dialog window

Create a bookmark
Bookmark and share maps
Create a bookmark

You can save your custom maps and share them with others through a bookmark link.

Click the Bookmark icon on the left toolbar and then click the three dots at the bottom of the bookmark panel. Choose Add Bookmark.

Share a bookmarked map
Bookmark and share maps
Share a bookmarked map

Next, choose the Extents and Layers option shown here to save your customized map layers and zoom settings. Be sure to name your bookmark something meaningful so it’s easy to find at a later date.

Select the bookmark link provided in the next panel and copy / paste to share it with others.

View your bookmark
Bookmark and share maps
view your bookmarks

To view your list of bookmarks, edit the name of a bookmark, delete or export a bookmark, or to locate the URL of a bookmark you’ve already created, click the Bookmark icon on the left toolbar to view your list of bookmarks.

Click the Info icon to the right of the bookmark name in your bookmarks list to copy/paste the bookmark link. This icon also provides helpful information about the map extend, layers activated, and when the bookmark was created.

Follow the prompts to delete, duplicate, or share a bookmark as a JSON file that can be imported into another person’s account.

D Prev
Next E

Dialog window

Layers
Explore data layers
Layers

Click the Layers icon in the left toolbar to view a list of PDC’s data layers. Layers are grouped by category into folders. Expand each folder to view the layers associated with a category.

With the layers panel open, you can also use the Search tab to locate layers by keyword (e.g. Philippines schools). Check the box to the left to view the layer on the map.


Identify active layers
Explore data layers
Identify active layers

To quickly see which map layers are turned on, click the Layers icon on the left toolbar and select the Search tab from the layers panel. All active layers are depicted by a check mark on the left. 


To turn all layers off, click the three dots at the bottom of the layers panel (as shown above), and choose Unselect All Layers.

Layer zoom
Explore data layers
Layer zoom

Click the zoom icon to the right of the layer (shown below) if you are having trouble viewing the layer you’ve selected. The map will zoom and re-center the map to bring the information into view.

Note: Some layers require the map to be zoomed to a minimum extent or to a specific location in order to display the information.

View hazard-specific layers
Explore data layers
View hazard-specific layers

Click a hazard icon on the map to launch the Hazard tooltip. From the tooltip, click the Layers link to see hazard-specific layers that you can turn on to help you better understand potential hazard impacts.


View country layers

Example subset of country map layers for Nicaragua 
(Infrastructure, hazard zones, clean water vulnerability index)


Explore data layers
View country layers

Types of country layers available in DisasterAWARE

While information varies from country to country, common datasets offered in DisasterAWARE include: critical infrastructure, population and demographic data, transportation, risk and vulnerability, and hazard zones information.

Search for country layers

With the Layers panel open, click the Search tab to search for layers by country name or keyword.

Locate global / subnational risk and vulnerability indicators
Explore data layers
View risk and vulnerability layers

Locate global / subnational risk and vulnerability indicators

Click the Layers icon in the left toolbar.

Scroll down to the Risk and Vulnerability folder. You can view a national comparison of overall multi-hazard risk. Expand the folder to drill deeper to inspect the national indicators of risk that contribute to the overall score.

Locate subnational risk and vulnerability indicators
Explore data layers
View risk and vulnerability layers

Locate subnational risk and vulnerability indicators
*Available for select countries only.


Click the Layers icon in the left toolbar. Scroll down to the Regional Data folder and open the regional subfolder in which the country of your interest resides.

Once in the proper regional subfolder, expand the Country folder > Risk and Vulnerability folder. You can view a comparison of overall risk and specific risk indicators at the subnational level.

Historical hazard layers
Explore data layers
Historical hazard layers

You can explore historical hazard data by selecting the type of hazard from the layers panel.

Click the Layers icon in the left toolbar. Scroll down to the Hazards and Events folder.

Expand the folder and navigate to the hazard type of your interest. Many types of hazards, although not all, have subfolders with historical information that can be viewed on the map.

Advanced search for historical hazards
Explore data layers
Advanced search for expired hazards

The Advanced Hazard Search is located under the Hazards panel and allows you to search active and historical DisasterAWARE Hazards. These include associated products such as custom maps, situation reports, damage assessments, and more.

Click the Hazard icon on the left toolbar to open the hazards panel.

Next, click the Filter icon on the top right of the panel to use the Advanced Hazard Search feature. When searching for historical hazard information, be sure to turn off the Active button and turn on the Expire button.

If applicable, insert the Name of the hazard, a Date range, and/ or Types of hazards you want to search.

D Prev
Next E

Dialog window

Hazard tooltip
Assess Hazard Impacts
Hazard tooltip

There are several tools to help you assess the potential impacts of hazards. To quickly view these tools,
navigate to an area on the map of interest to you and click a hazard icon.

A hazard tooltip will appear with “quick links” to more information about the hazard. The tooltip provides quick links to Products, Info, Layers, and Area Brief.

Products
Assess Hazard Impacts
Products

The Products link provides access to a variety of reports, custom maps, analyses, and other information shared by multiple agencies about the hazard. Below is an example of product types:

Situational Awareness Products (for specialized maps, analyses, modeled impact assessments)
Situation Reports (for detailed agency updates of the situation on the ground)
Damage and Needs Assessments (for information related to damage and needs)
Reference Maps (for response and recovery planning)

Info
Assess Hazard Impacts
Info

The Info link contains the latest advisory information issued by authoritative agencies, along with potential impact information provided by PDC’s All Hazards Impact Model.


With the Info panel open, click the More Information button to see a summary of potential impacts reported in PDC’s Hazard Brief.

Hazard Brief
Assess Hazard Impacts
MORE Info: Hazard Brief

Hazard Brief summarizes potential impacts to populations and infrastructure, breaking down exposure by demographic, geography, and population centers.

It also describes risk factors for vulnerable groups and offers a wealth of additional information about the hazard.

Layers
Assess Hazard Impacts
Layers

The Layers link allows you to view default hazard layers and explore other pertinent information to help assess potential impacts of a hazard.

For example, the Ash Cloud layer shown here details the spread of volcanic ash within 6 hours after an eruption in Ecuador based on the latest ash cloud advisory. This can help determine where the deposit of ash potentially intersects with at-risk populations and infrastructure when those layers are also turned on.

D Prev
Next E

Dialog window

Get text and Email notifications
Smart Alert
Sign up for SmartAlert Notifications

Click the SmartAlert icon from the left toolbar. While in the SmartAlert Preferences panel, check the box alongside Email or SMS (text message), or select both types of alerts.

Select geographic areas for alerts
Smart Alert
Select geographic areas for alerts

Click on the Alert Area(s) link. use the Circle, Polygon, or Rectangle shape tools to draw one or more alert areas.

Specify hazards and severities for alerts
Smart Alert
Specify hazards and severities for alerts

Click on the Selected Hazards link.

Next, choose the severities for each type of hazard notification you’d like to receive. You will only receive alerts that meet or exceed your chosen severity.

Smart Alert Hazard Notifications
Smart Alert
Get Hazard Notifications

Smart Alert Hazard notifications will be displayed in the DisasterAWARE app and based on your notification settings, may be emailed or texted to you as well.

D Prev
Next E

Dialog window

Zoom Tools
Map Navigaton Basics
Zooming in and out

There are several ways to zoom in and out on the map.

Select the “+” symbol from the right navigation toolbar to zoom in closer to the center of the map.

Select the “-” symbol from the right navigation toolbar to zoom away from the center of the map.

Use the zoom select tool to click and drag over an area of the map to zoom into.

Avoid using the key command “Control +” or “Command +” on the Mac. This will zoom the browser window and result in an optimized screen view with fewer features.

Panning and Scrolling
Map Navigation Basics
Panning and Scrolling

Use the pan tool to click and drag the map up, down, left, and right to navigate to a location on the map.

Use your mouse or trackpad to scroll or swipe the map up, down, left, and right.

Be sure your browser zoom settings are reset to 100%. If the browser window is zoomed in or out, it may result in an optimized screen view with fewer features.

Mobile Navigation
Map Navigation Basics
Mobile Navigation

Select the “+” symbol from the right navigation toolbar to zoom in closer to the center of the map.

Select the “-” symbol from the right navigation toolbar to zoom away from the center of the map.

Mobile menu: To locate all application tools and features, close any open windows byclicking the “x” in the top right corner of the app. You will then be able to see and click the mobile menu at the bottom right of your screen.

Hazard Panel
Map Navigation Basics
Locate Hazards

Click the Hazard Icon on the left toolbar to display the current hazard list. Use the search window to search by hazard name, type, location or other keyword. Scroll down to review all the hazards.

Click on the Go to: coordinates to quickly zoom to a hazard.

Assessing Hazard Panel
Map Navigation Basics
Assessing Hazard Impacts

Click a hazard icon on the map to launch the hazard tooltip. From the hazard tooltip, click one of the many “quick links” described below:

D Prev
Next E

Dialog window

Request Access
Step 1
REQUEST ACCESS

Access to DisasterAWARE is free for the disaster management community including government agencies and humanitarian assistance organizations. View minimum system requirements.

Visit disasteraware.www.pdc.org. Click the "Request Access" link and complete the form. You will receive confirmation within 24 hrs of your request.

Log In
Step 2
LOG IN

Once access is approved, visit emops.www.pdc.org and login with the username and temporary password provided in the confirmation email.

Configure and Optimize
Step 3
CONFIGURE & OPTIMIZE

Turn on browser cookies and allow pop-ups.

You must have a broadband internet connection with a minimum of 4 Mbps or 4G for mobile data connections.

Trouble logging in?
Trouble logging in?

Visit the Log In page and try the forgot password link.

If you still need asssistance, contact us at: disaster@pdc.org

D Prev
Next E
  • OUR CAPABILITIES
    • Early Warning Technology
    • Advanced Analytics
    • Artificial Intelligence
    • Training and Exercises
  • NEWSROOM
    • Latest News
    • Fact Sheets
    • Media Kit
    • Daily Tropical Cyclone Tracker
  • REPORTS & PUBLICATIONS
    • Search Library
    • Annual Reports
    • Case Studies
    • National Disaster Preparedness Baseline Assessment Reports
  • ONLINE TRAINING
  • ABOUT
  • CONTACT

News Archives

  • Follow
  • Follow
  • Follow
  • Follow
  • Follow

Twenty years after the world’s deadliest tsunami—what have we learned and are we safer?

Dec 20, 2024 | DisasterAWARE, Latest Stories

Two decades have passed since one of the deadliest natural disasters in recorded history claimed the lives of 228,000 people across 14 countries. For a younger generation, there’s little awareness of the colossal 9.1 magnitude earthquake that struck off the western coast of northern Sumatra, Indonesia, unleashing the deadliest tsunami in recorded history

PDC joins U.S. Navy’s goodwill mission in Latin America, Caribbean

Aug 19, 2024 | DisasterAWARE, Latest Stories

Latin America and the Caribbean—At the invitation of U.S. Navy 4th Fleet and U.S. Southern...

One year after the Maui wildfire catastrophe

Aug 7, 2024 | Disaster Response, DisasterAWARE, Latest Stories, Partner Projects

PDC's message of hope and commitment to Maui’s resilience and recovery   Maui Island,...

Bahamian professionals use PDC’s Train-the-Trainer program to strengthen disaster management capacity

Jul 19, 2024 | DisasterAWARE, Latest Stories

Nassau, The Bahamas—A longstanding partnership between the University of Hawai'i's Pacific...

NASA, Pacific Disaster Center release new landslide hazard alerting capability

Oct 26, 2023 | Early Warning, Latest Stories

Communities worldwide now have access to a powerful tool to increase their awareness of...

Explore topics

  • Advanced Analytics
  • Annual Report
  • Awards
  • Disaster Response
  • DisasterAWARE
  • Early Warning
  • Exercises and Training
  • Latest Stories
  • National Disaster Preparedness Baseline Assessment
  • Partner Projects
  • Partnerships
  • Press Kit
  • training and exercise slides

Early Warning

AI for Humanity

Advanced Analytics

Training and Exercises

Publications

Media Kit

Newsroom

Contact

  • Follow
  • Follow
  • Follow
  • Follow
  • Follow

Early Warning

AI for Humanity

Advanced Analytics

Publications

Training and Exercises

Newsroom

Media Kit

Contact

  • Follow
  • Follow
  • Follow
  • Follow
  • Follow
© 2025 Pacific Disaster Center. All rights reserved. See Terms and Conditions and Privacy Policy.